


🔍 Overview
As a passionate DeFi contributor, Chaos Labs is always excited to partner with top DeFi protocols. dYdX is the leading decentralized exchange that supports perpetuals and is a leader in the space. As part of our commitment and mission to drive DeFi adoption, Chaos Labs builds and publishes open-source tools for the larger developer ecosystem. Today, we are publishing the first Market Maker Liquidity Rewards Distribution Report.
📉 Liquidity Provider Rewards Program
The goal of the Liquidity Provider Rewards program is to incentivize market makers to provide meaningful liquidity. Ideally, incentives should motivate makers to tighten spreads and compete on volume. However, after several epochs, we’ve identified cases in which incentive distribution could be improved to better align with impactful liquidity provisioning. This summary will review the current formula, examine live proposals and elaborate on our analysis highlighting the tradeoffs each approach introduces.
Q-Score
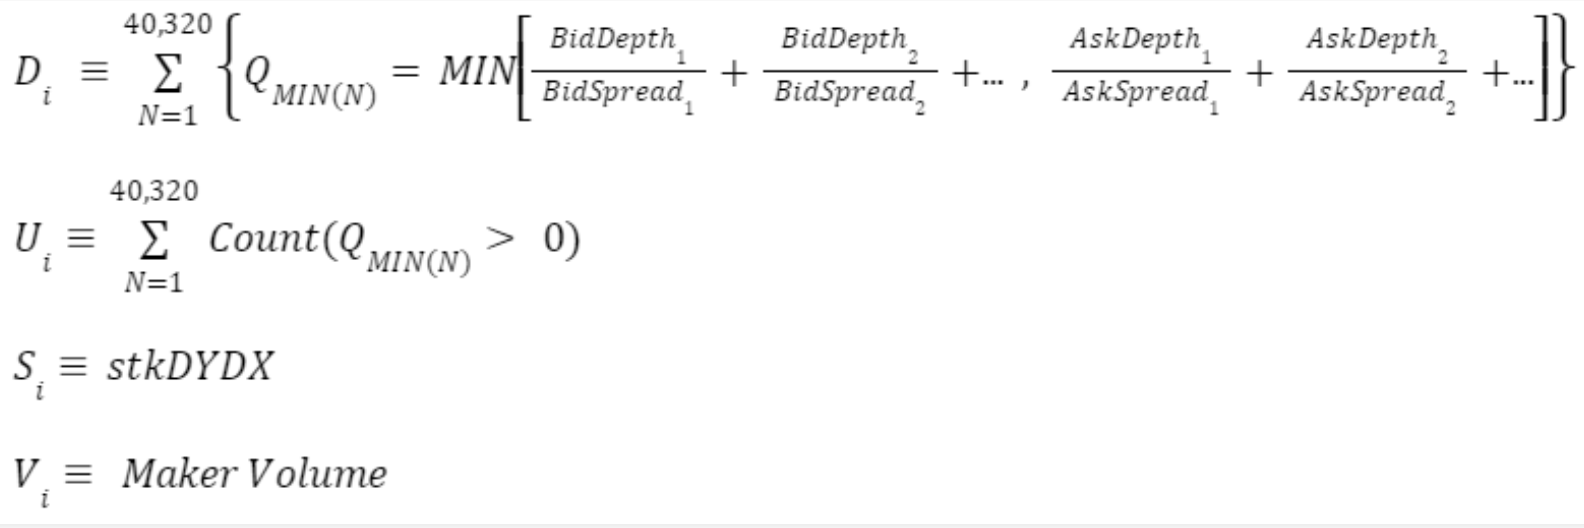
To incentivize market liquidity, $DYDX will be distributed to liquidity providers based on a formula that rewards participation in markets. The formula focuses on the following parameters:
- Two-sided depth
- Spread (vs. mid-market)
- Uptime on dYdX’s Layer 2 Protocol
Any Ethereum address can earn these rewards, subject to a minimum maker volume threshold of 0.25% of total maker volume in the preceding epoch. $DYDX will be distributed on a 28-day epoch basis over five years and are not subject to any vesting or lockups. 1,150,685 $DYDX will be distributed per epoch.
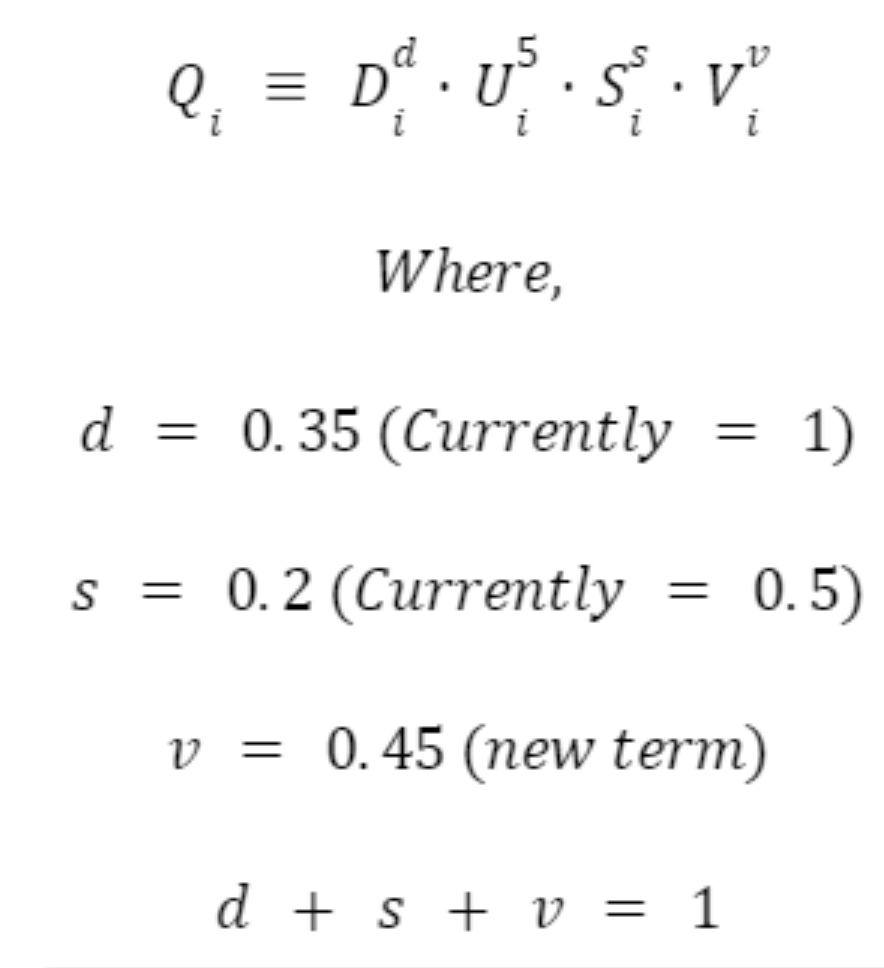
The following function is used to compute how much $DYDX should be rewarded to each liquidity provider per epoch. The amount of DYDX earned is determined by the relative share of each participant’s Q-Final

While this formula is powerful and incentivizes important factors it is suboptimal in distributing incentives fairly as it does not factor in maker volume. Let’s look at several examples that highlight cases of disproportional rewards distribution as a function of maker volume.
Analysis of Q-Score Historical Performance
Q-Score has been used to compute LP reward distribution over numerous epochs. After analyzing the distribution of rewards across several epochs it is clear that Q-Score is sub-optimal and allows for unfair distributions.
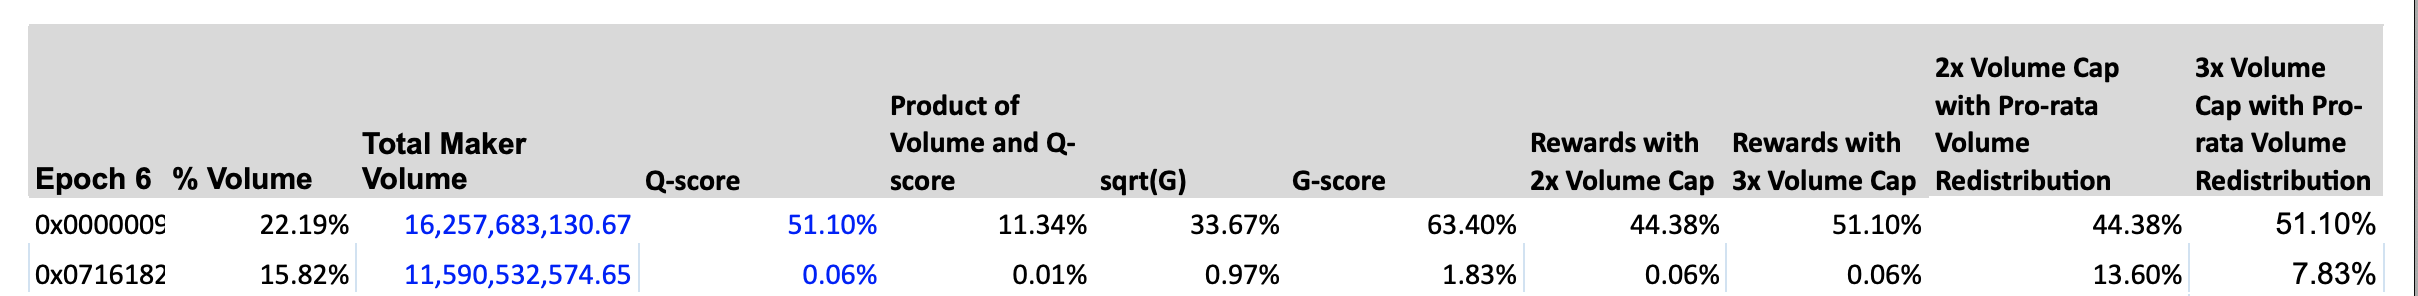
Figure 1.1 clearly highlights some of the challenges. Let’s look at the maker depicted as account #5 (X-axis). This maker has contributed relatively low volume and has a disproportionate Q-score.

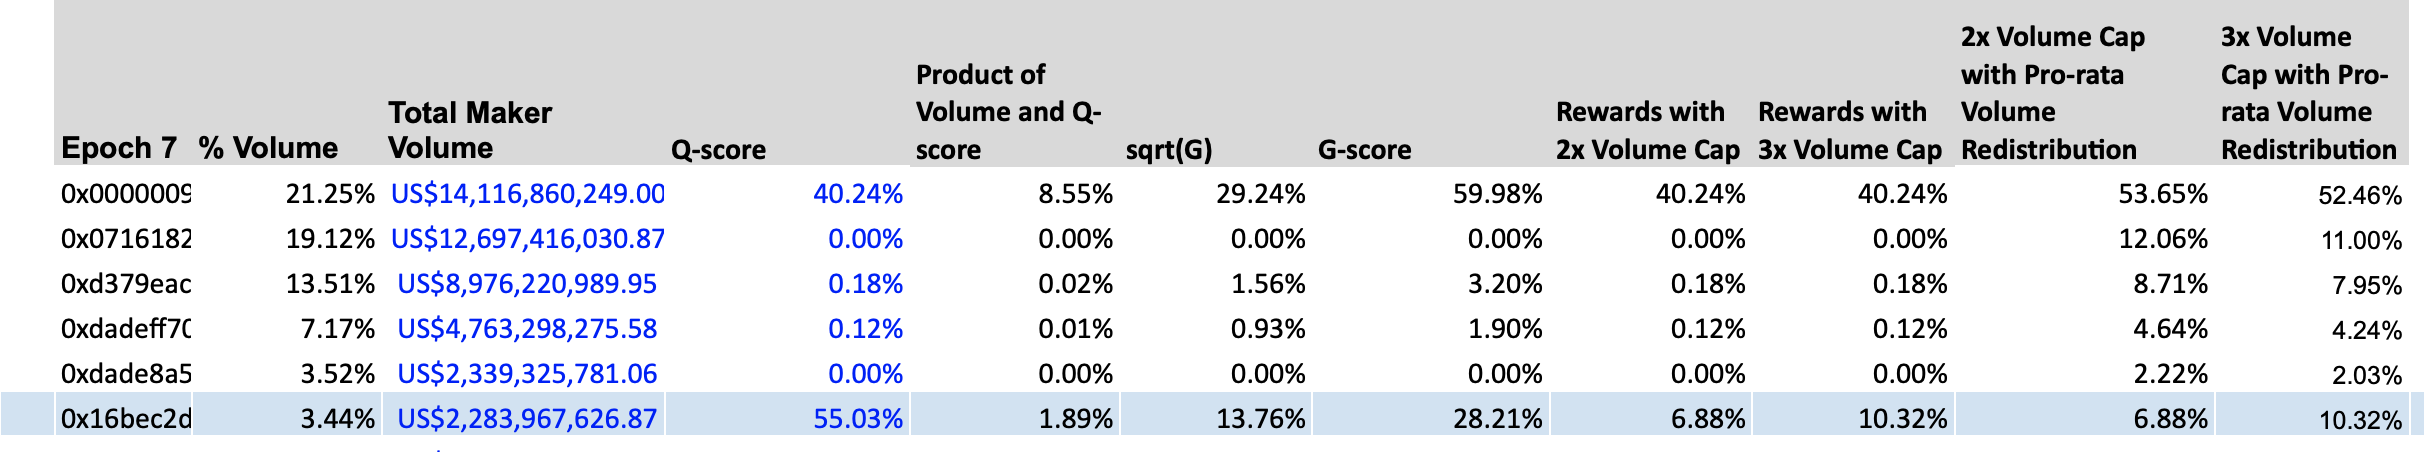
Figure 1.2: This image is a screenshot of distributions observed in Epoch 7. Here we can clearly view a low relative volume contribution with an ~18x multiplier on Q-Score.

Furthermore, Account #11 has a similar Q-score/volume inversion, albeit at a smaller scale. A relatively quick analysis of historical distributions highlights suboptimal outcomes.
Preliminary Evaluation of G Score & Capping based on Historical Data
We set out to evaluate the 3 proposed modifications to the Q score-based reward distribution formula.
- G score
- Defined as the equal-weighted geometric average of the proportion of Q-score and the volume share of a given address. We then distribute rewards according to the proportions of the G-score.
- 2/3 x Capping
- Cap the maximum possible reward at 2-3x of the relative volume contributed by a single address. We redistribute the remaining rewards pro-rata according to the volume share of the remaining rewards participants.
- Wintermute New Rewards Distribution
- Introduce maker volume and capped rewards (optional), as well as reduce the weight of depth, spread, and stkDYDX in the calculation of liquidity provider rewards.
The total rewards score for an individual LP, $Q_i$, is then calculated as follows:
G-Score Analysis
Overall rewards distribution is fairer from a volume perspective compared to the Q-score alternative in place today. There are some potential risks and pitfalls we have identified through analyzing the historical distributions:
1. Over-compensation Risk
G-score compounds the volume portion with the Q-score. This can lead to a G-score that is several times greater than the Q score. We identified cases where a single significant LP (Liquidity Provider) received ~60% of the reward pool. We estimate that in some cases a single maker can achieve ~70% of reward distributions. Previously, these cases were bounded to 40%-50%. While lopsided reward distribution can be legitimate, it can lead to a single LP dominating the market. This can discourage smaller makers, and monopolize protocol liquidity. In the long term, a lack of maker competition and diversity will harm the protocol and lead to a decrease in overall decentralization.
2. Fairness Inefficiency
When optimizing for rewards distribution fairness with trading volume in mind, we have found several occurrences of G-score underperforming. There are concrete examples of LPs with a G-score that is ~30 times their trading volume.

3. Zero-Sum Reward Distribution
We must consider the inverse risk introduced by “Fairness Inefficiency”. Ultimately, reward distribution is zero-sum. When larger makers are able to skew distributions “honest” makers get hurt. This can lead makers to decide to provide liquidity on different platforms and/or protocols.
Reward Capping Analysis
Capping introduces a much stronger correlation to trading volume compared to Q-score and G-score. However, after analyzing historical distributions, we’ve identified new pitfalls and types of unfairness.
- Capping heavily incentivizes trading volume even with very low Q scores. This enables rewards of up to 100-250x the Q score.
- Capping can significantly reduce Q-Score rewards. This can minimize the weight of the Q-score relative to trading volume.
Wintermute Proposal - Analysis of Historical Data
Proposed Weighting
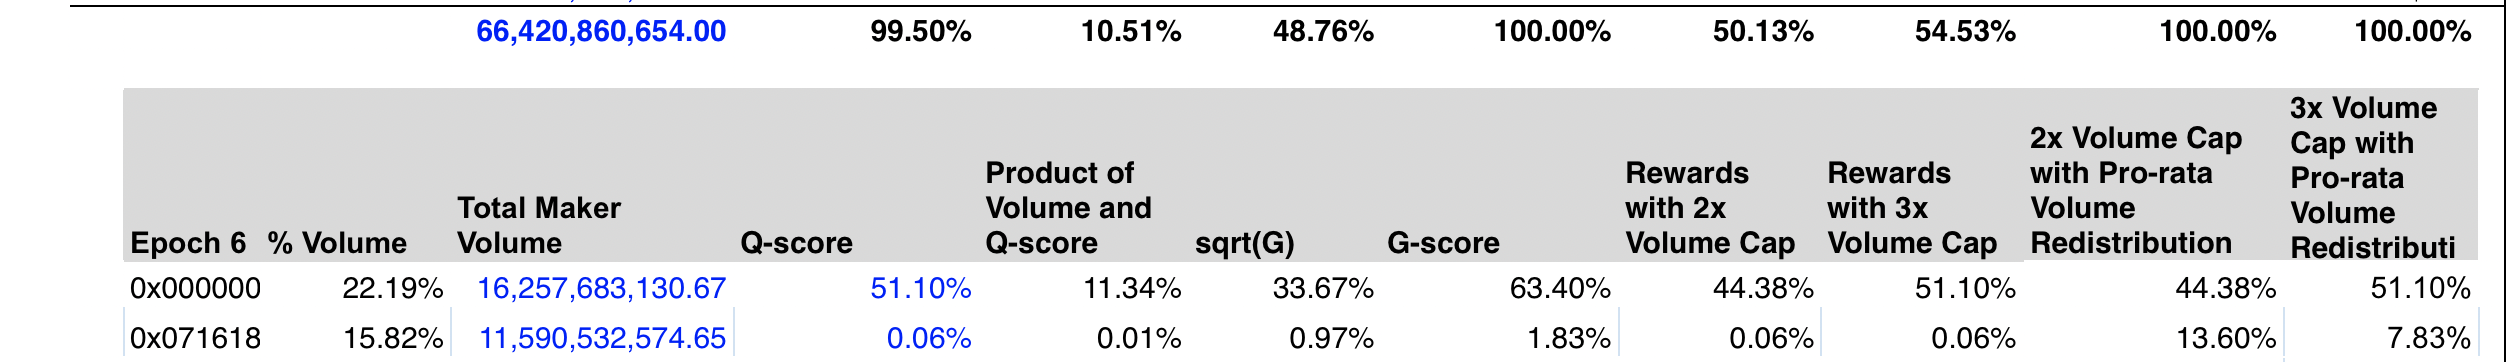
Figure 2.1

We see similar performance using the Weighted-Score with suggested scaling parameters (v=0.45, d=0.35, s=0.2), and uncapped G score (green and red markers respectively). 78% of rewards are still distributed to these two accounts using the Weighted Score, while 80.5% using the uncapped G score.

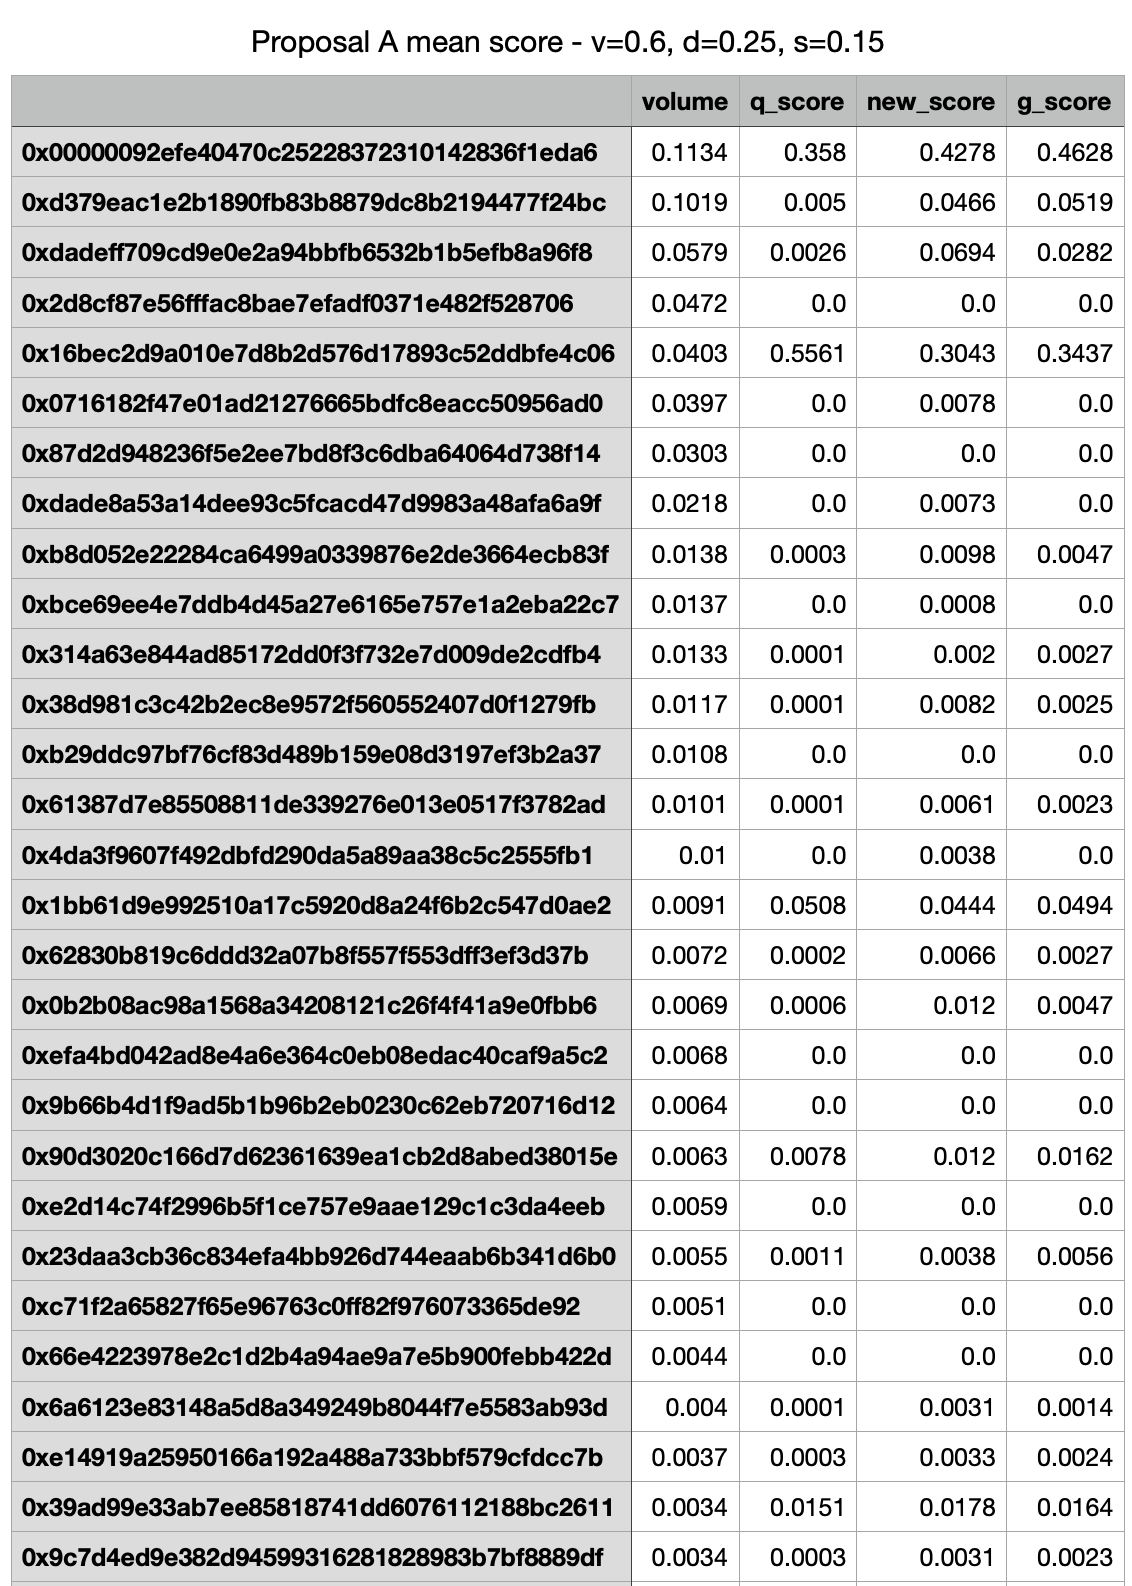
Heavily Favor Maker Volume:
Figure 2.2

Here we use a weighted score, setting scaling parameters to heavily favor volume (v=0.6, d=0.25, s=0.15), we achieve better penalization of account #4, while account #0 is rewarded similarly to the original set of parameters. However, 73% of rewards are still distributed to these two accounts.
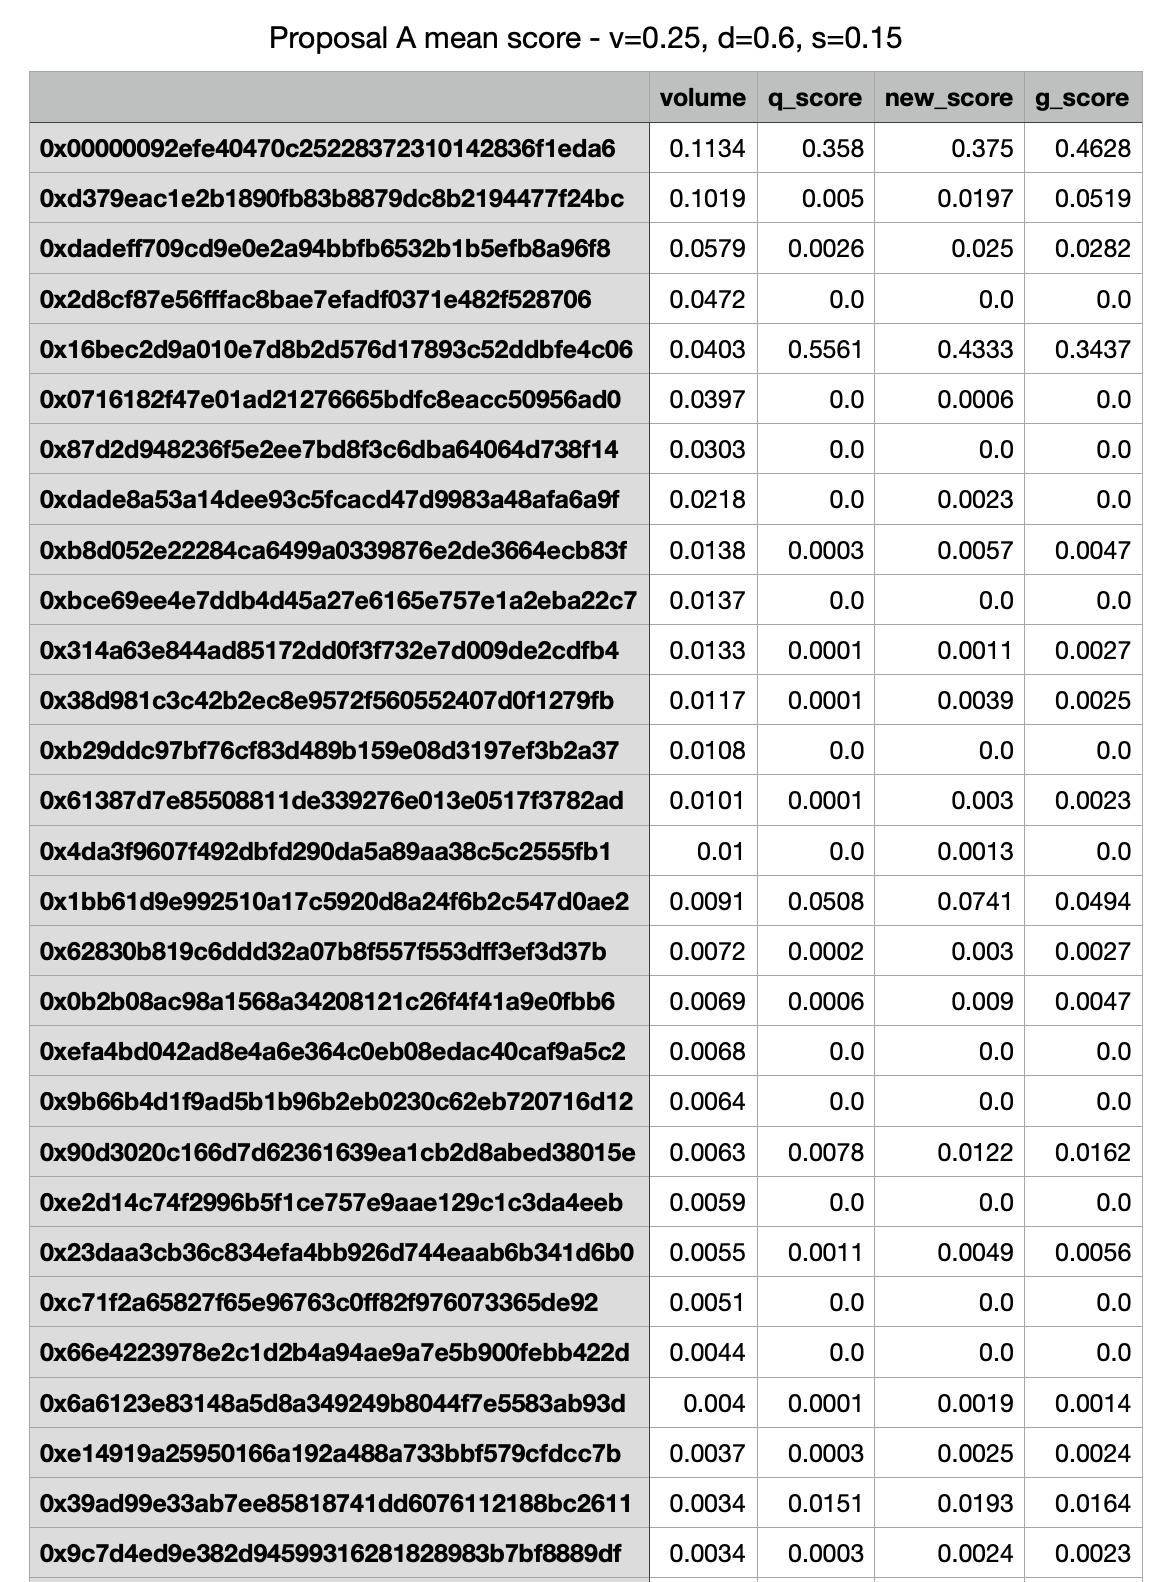
Heavily Favor Depth / Spread
Figure 2.3

Here we use a Weighted-Score, setting scaling parameters to heavily favor Depth/Spread (v=0.25, d=0.6, s=0.15), we achieve worse penalization of account #4, while account #0 is penalized compared to the original set of parameters. 81% of rewards are still distributed to these two accounts.
Initial Recommendations
Taking into account dYdX’s desire to act quickly to remediate the current state of rewards distribution we aim to provide short-term recommendations based solely on the current historical data available. We then aim to conduct deep research and analysis-based simulation data to achieve a more balanced and fairer solution for the long term.
Immediate Recs
From the immediate analysis of both improvement proposals (G-score/ Weighted-Score, with or without capping), we conclude that they are both preferred remediations to rewards distribution unfairness. We look at G-score as a private case of the Weighted-Score, giving equal weight to volume and Q-scores. Clearly then the Weighted-Score method has the advantage of being able to adjust the weights. Looking at the analysis of historical data, it is not perfectly clear which weights are better in achieving desired liquidity, but using simulations to test performance on a wider range of input synthetic data shows G-score weights are not optimal, and using suggested weights (v=0.45, d=0.35, s=0.2) does a better job in the sense of rewarding smaller LPs, while not over-penalizing Large ‘passive’ LPs (LPs with high trading volume in comparison to a low Q-Score).
Capping on the other hand does a better job of providing fairness, but simultaneously poses a greater risk. We view this as a solution that is easier to manipulate.
For these reasons, we recommend implementing the Weighted-Score/G-score over Capping in the short term with a period of time to further review.
Longer-term Recommendations
As we were able to not only identify immediate pitfalls to the current proposals but also find historical cases of them being inefficient or adversarial, we strongly recommend conducting deeper research and analysis to come up with a more robust, battle-tested formula to achieve dYdX goals of fairness across its 4 pillars: depth, spread, uptime, and volume.
It is clear that the Weighted-Score/G-score approaches are a step in the right direction but we assess the weight distribution between the pillar is still not optimal.
Research and Evaluation - Utilizing Synthetic Data Sets
At Chaos Labs, we specialize in building robust agent-based simulations that model real user behavior to predict and test for any possible scenario.
We leveraged our simulation platform to simulate possible future epochs. In order to achieve simulated epochs that correlate to reality we constructed the following user modes:
- Large Market Makers - LPs with a lot of liquidity that can compete for high Q-scores
- Small Market Makers - LPs that have a low probability of achieving high Q-scores
- Adversarial Market Markers - LPs that actively try and often succeed at gaming the Q-scores and other aspects
Working from the 3 base user models above, we evaluated the possibility of an LP falling into 1 or more of these buckets based on historical data to achieve simulated epochs that are close to reality and are statistically possible.
After building these models we generated 10,000 possible epochs and used them to compare the efficiency of the G-score formula on key metrics.
Note - There is a lot more information and insights to derive from these simulations. This would require building more sophisticated models and adjusting our predictions and conclusions accordingly. The research presented factors in the short time frame and the immediate goal of going live with G-Score in the short term.
Simulations Analysis Highlights
Q-score, G-score, Weighted-Score on top performers
The following graphs aggregate results from 10,000 simulations to compare G-score versus Q-score in terms of rewards distributed to the top performer in each epoch:

X-Axis: Max Q Score for a single maker.
Y-Axis: Count per 10k simulations.
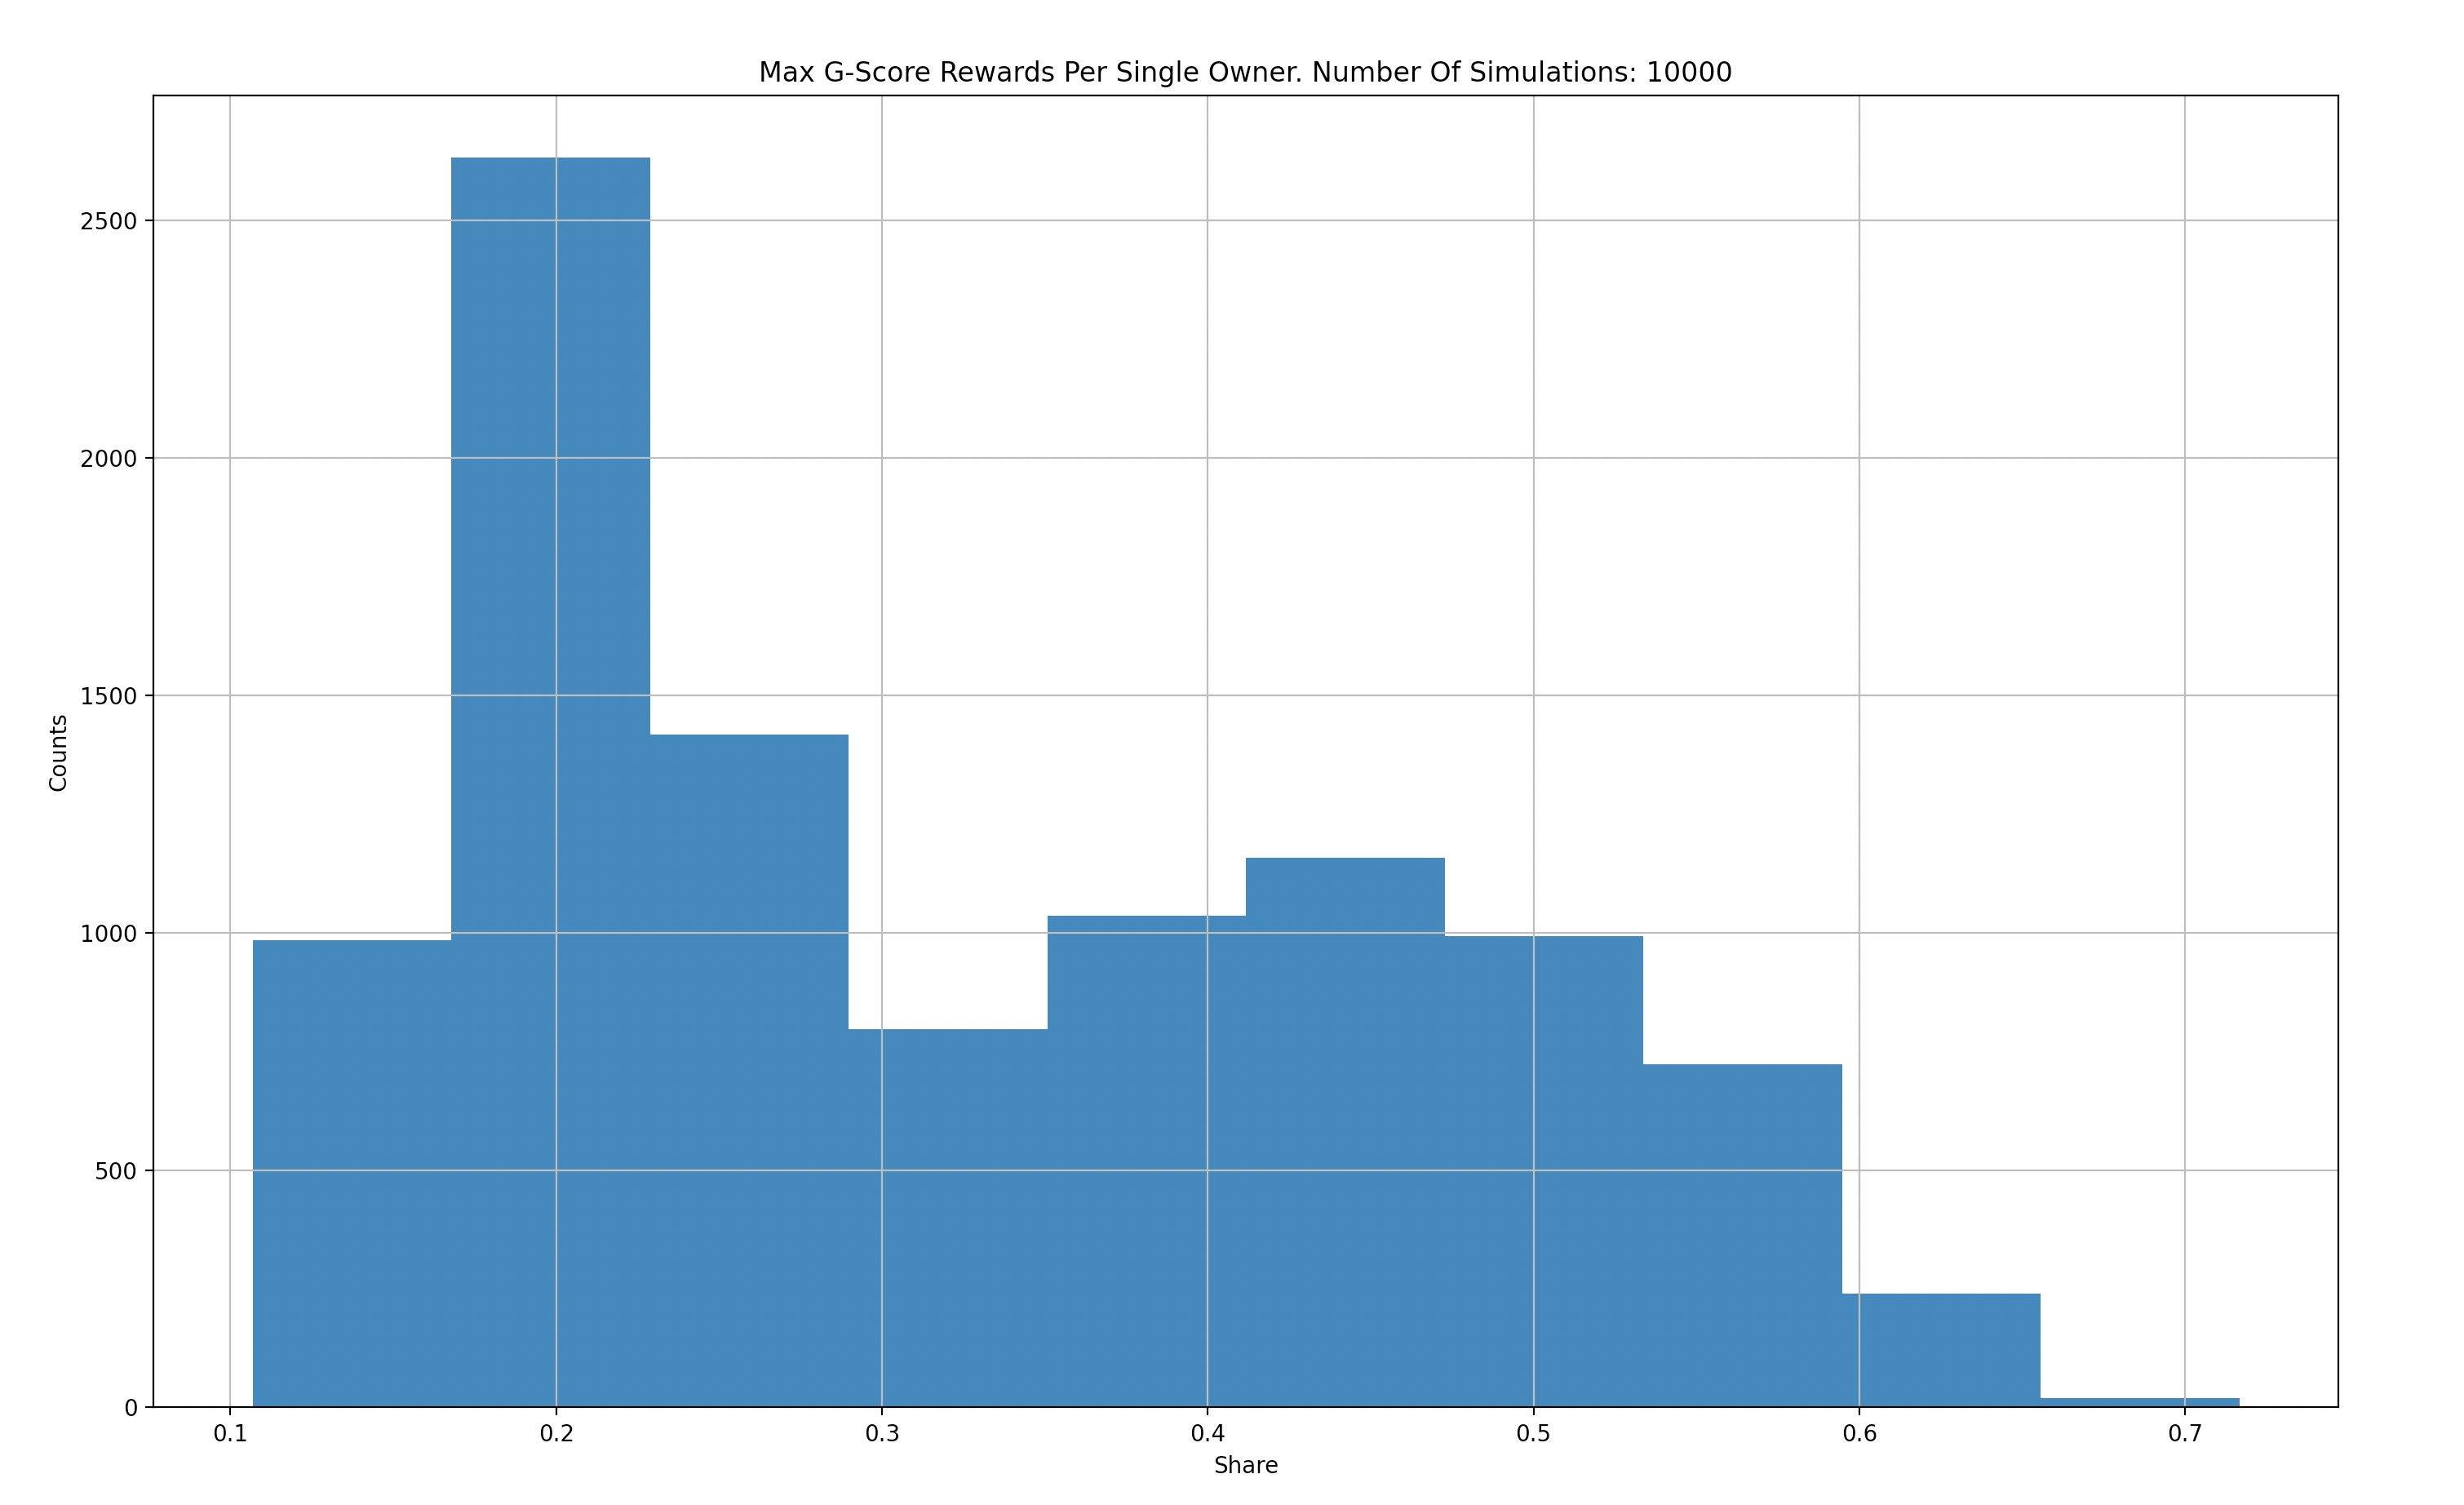
X-Axis: Max G Score for a single maker.
Y-Axis: Count per 10k simulations.
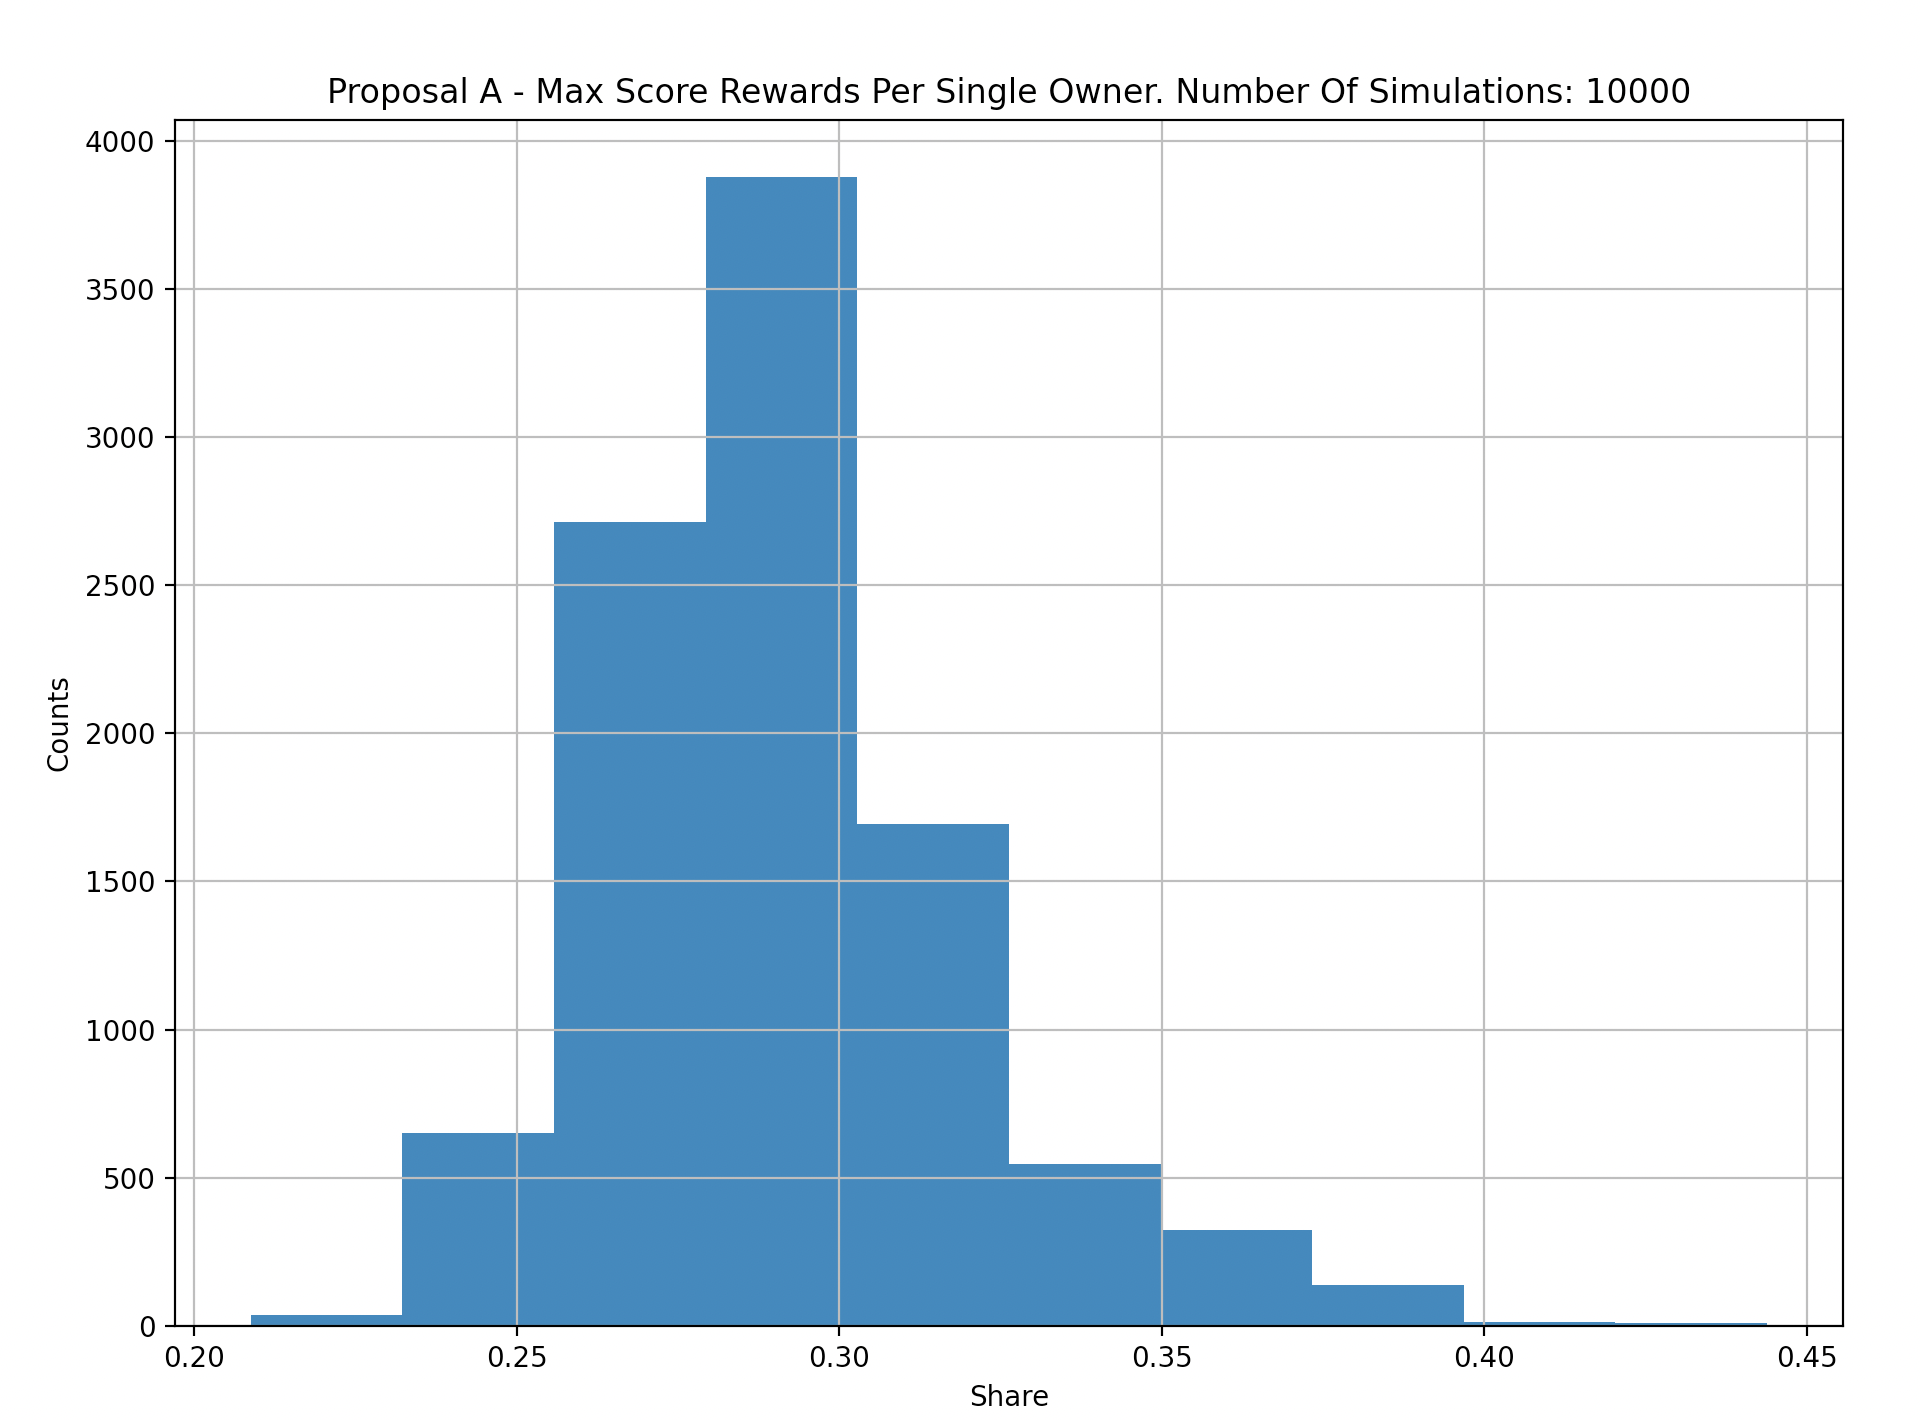
X-Axis: Max Weighted Score for a single maker.
Y-Axis: Count per 10k simulations.
We can see that overall, G-score reduces the likelihood of a single top performer obtaining the lion-share of the rewards. As we’ve seen in the historical data, that is not always the case which is why we want to iterate on our ‘Gamers’ market makers models to simulate them with closer proximity to reality.
A Weighted-Score reduces the likelihood for a single user to obtain over 40% of rewards over simulated input data compared to G-score which had 50-60% in rare but possible cases. This fact makes it clear that it’s preferable to the G-score alternative.
G-score, Weighted-Score versus Q-score based on volume fairness
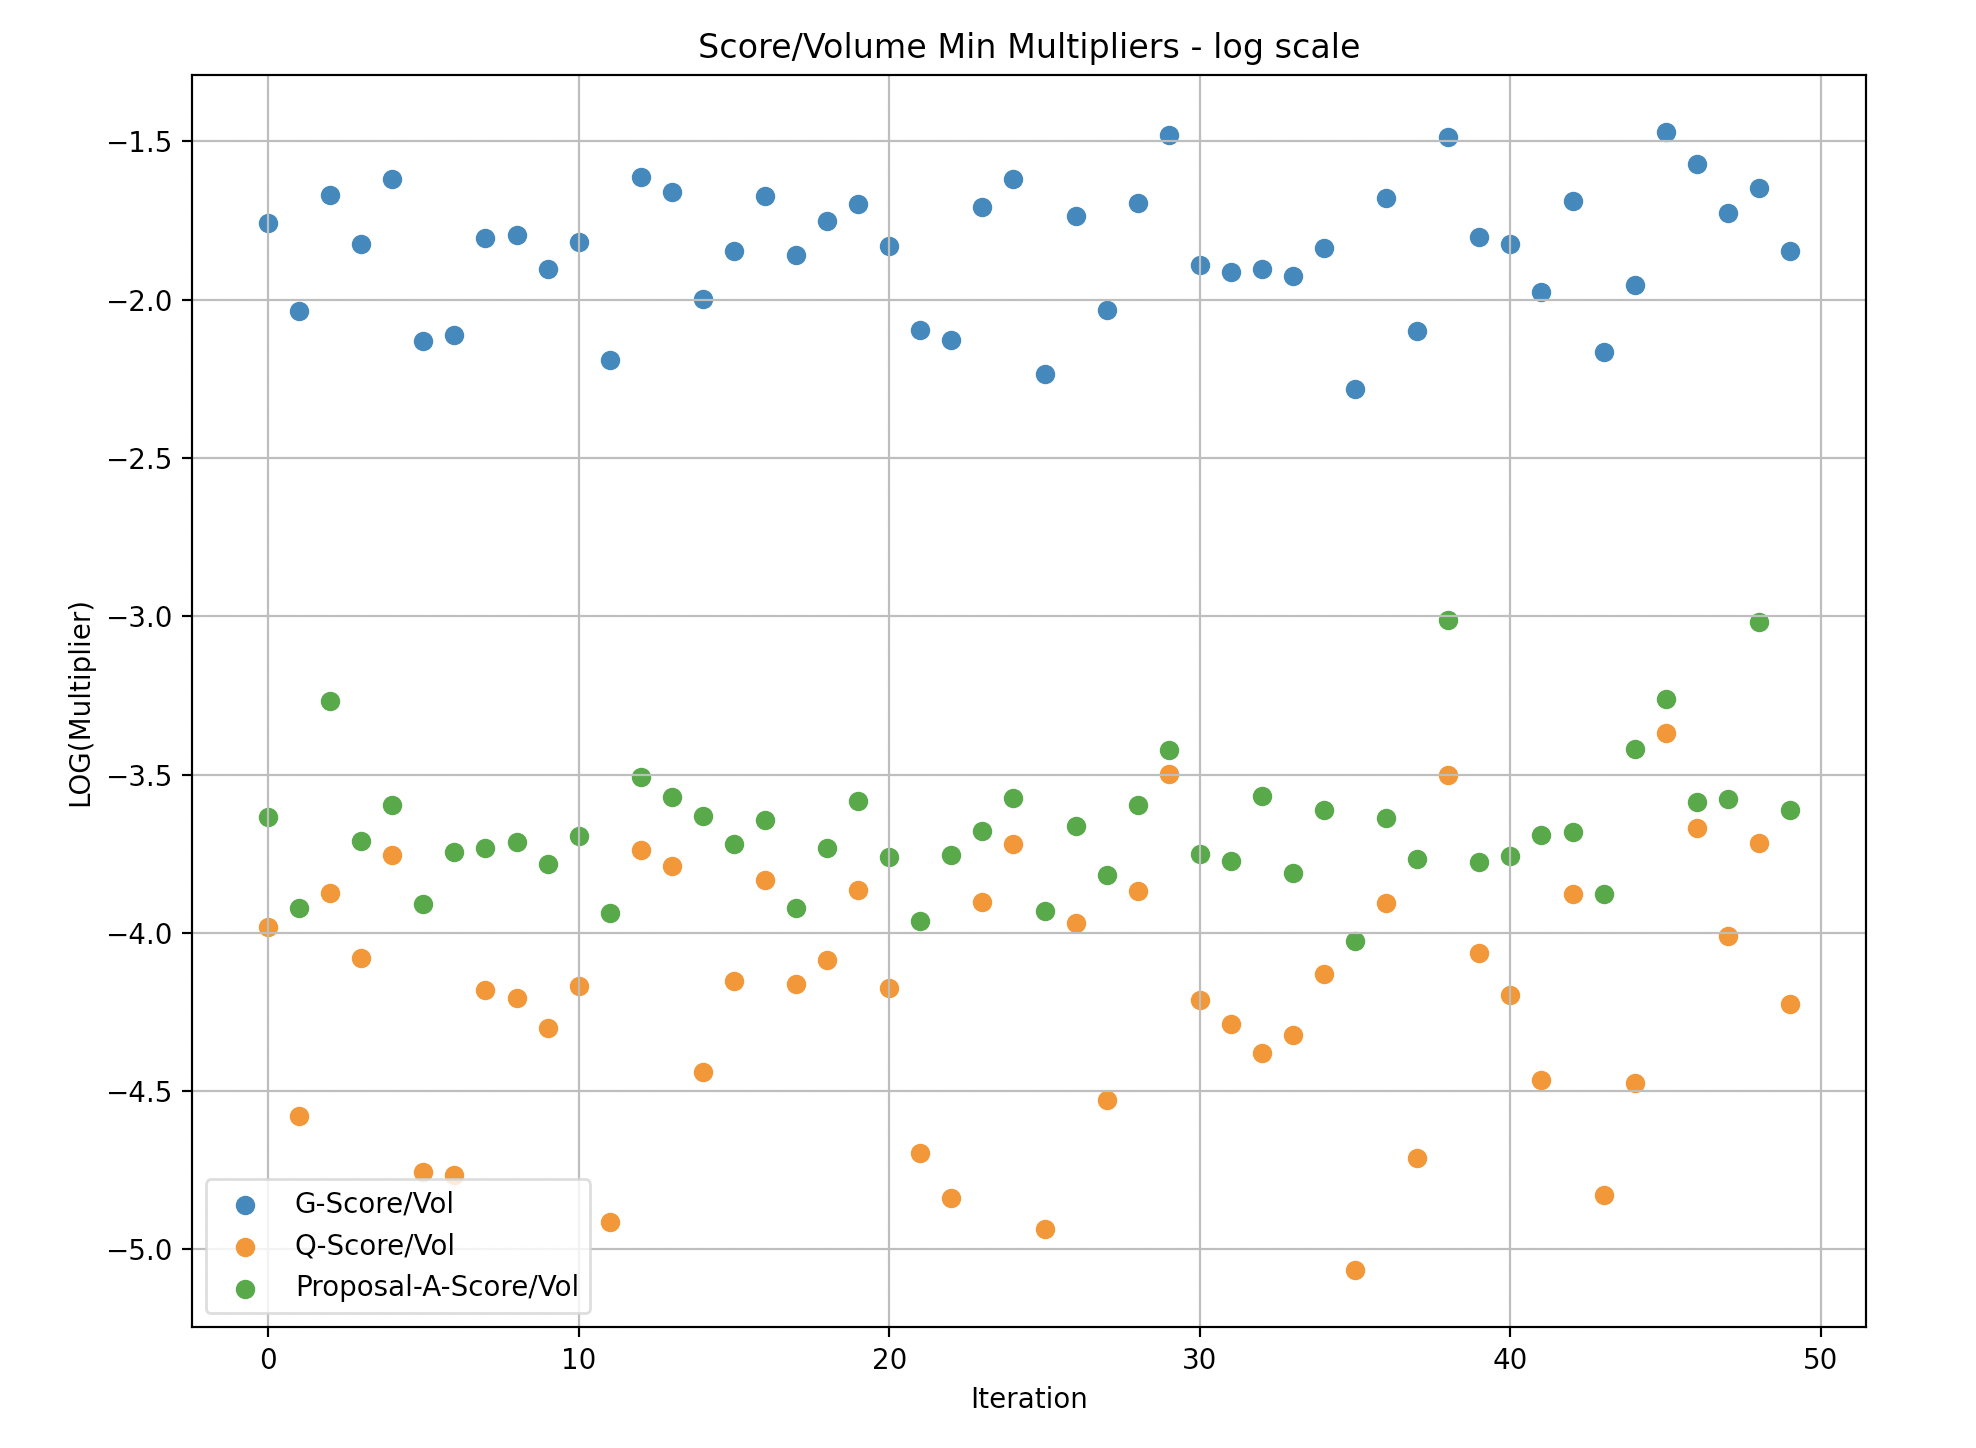
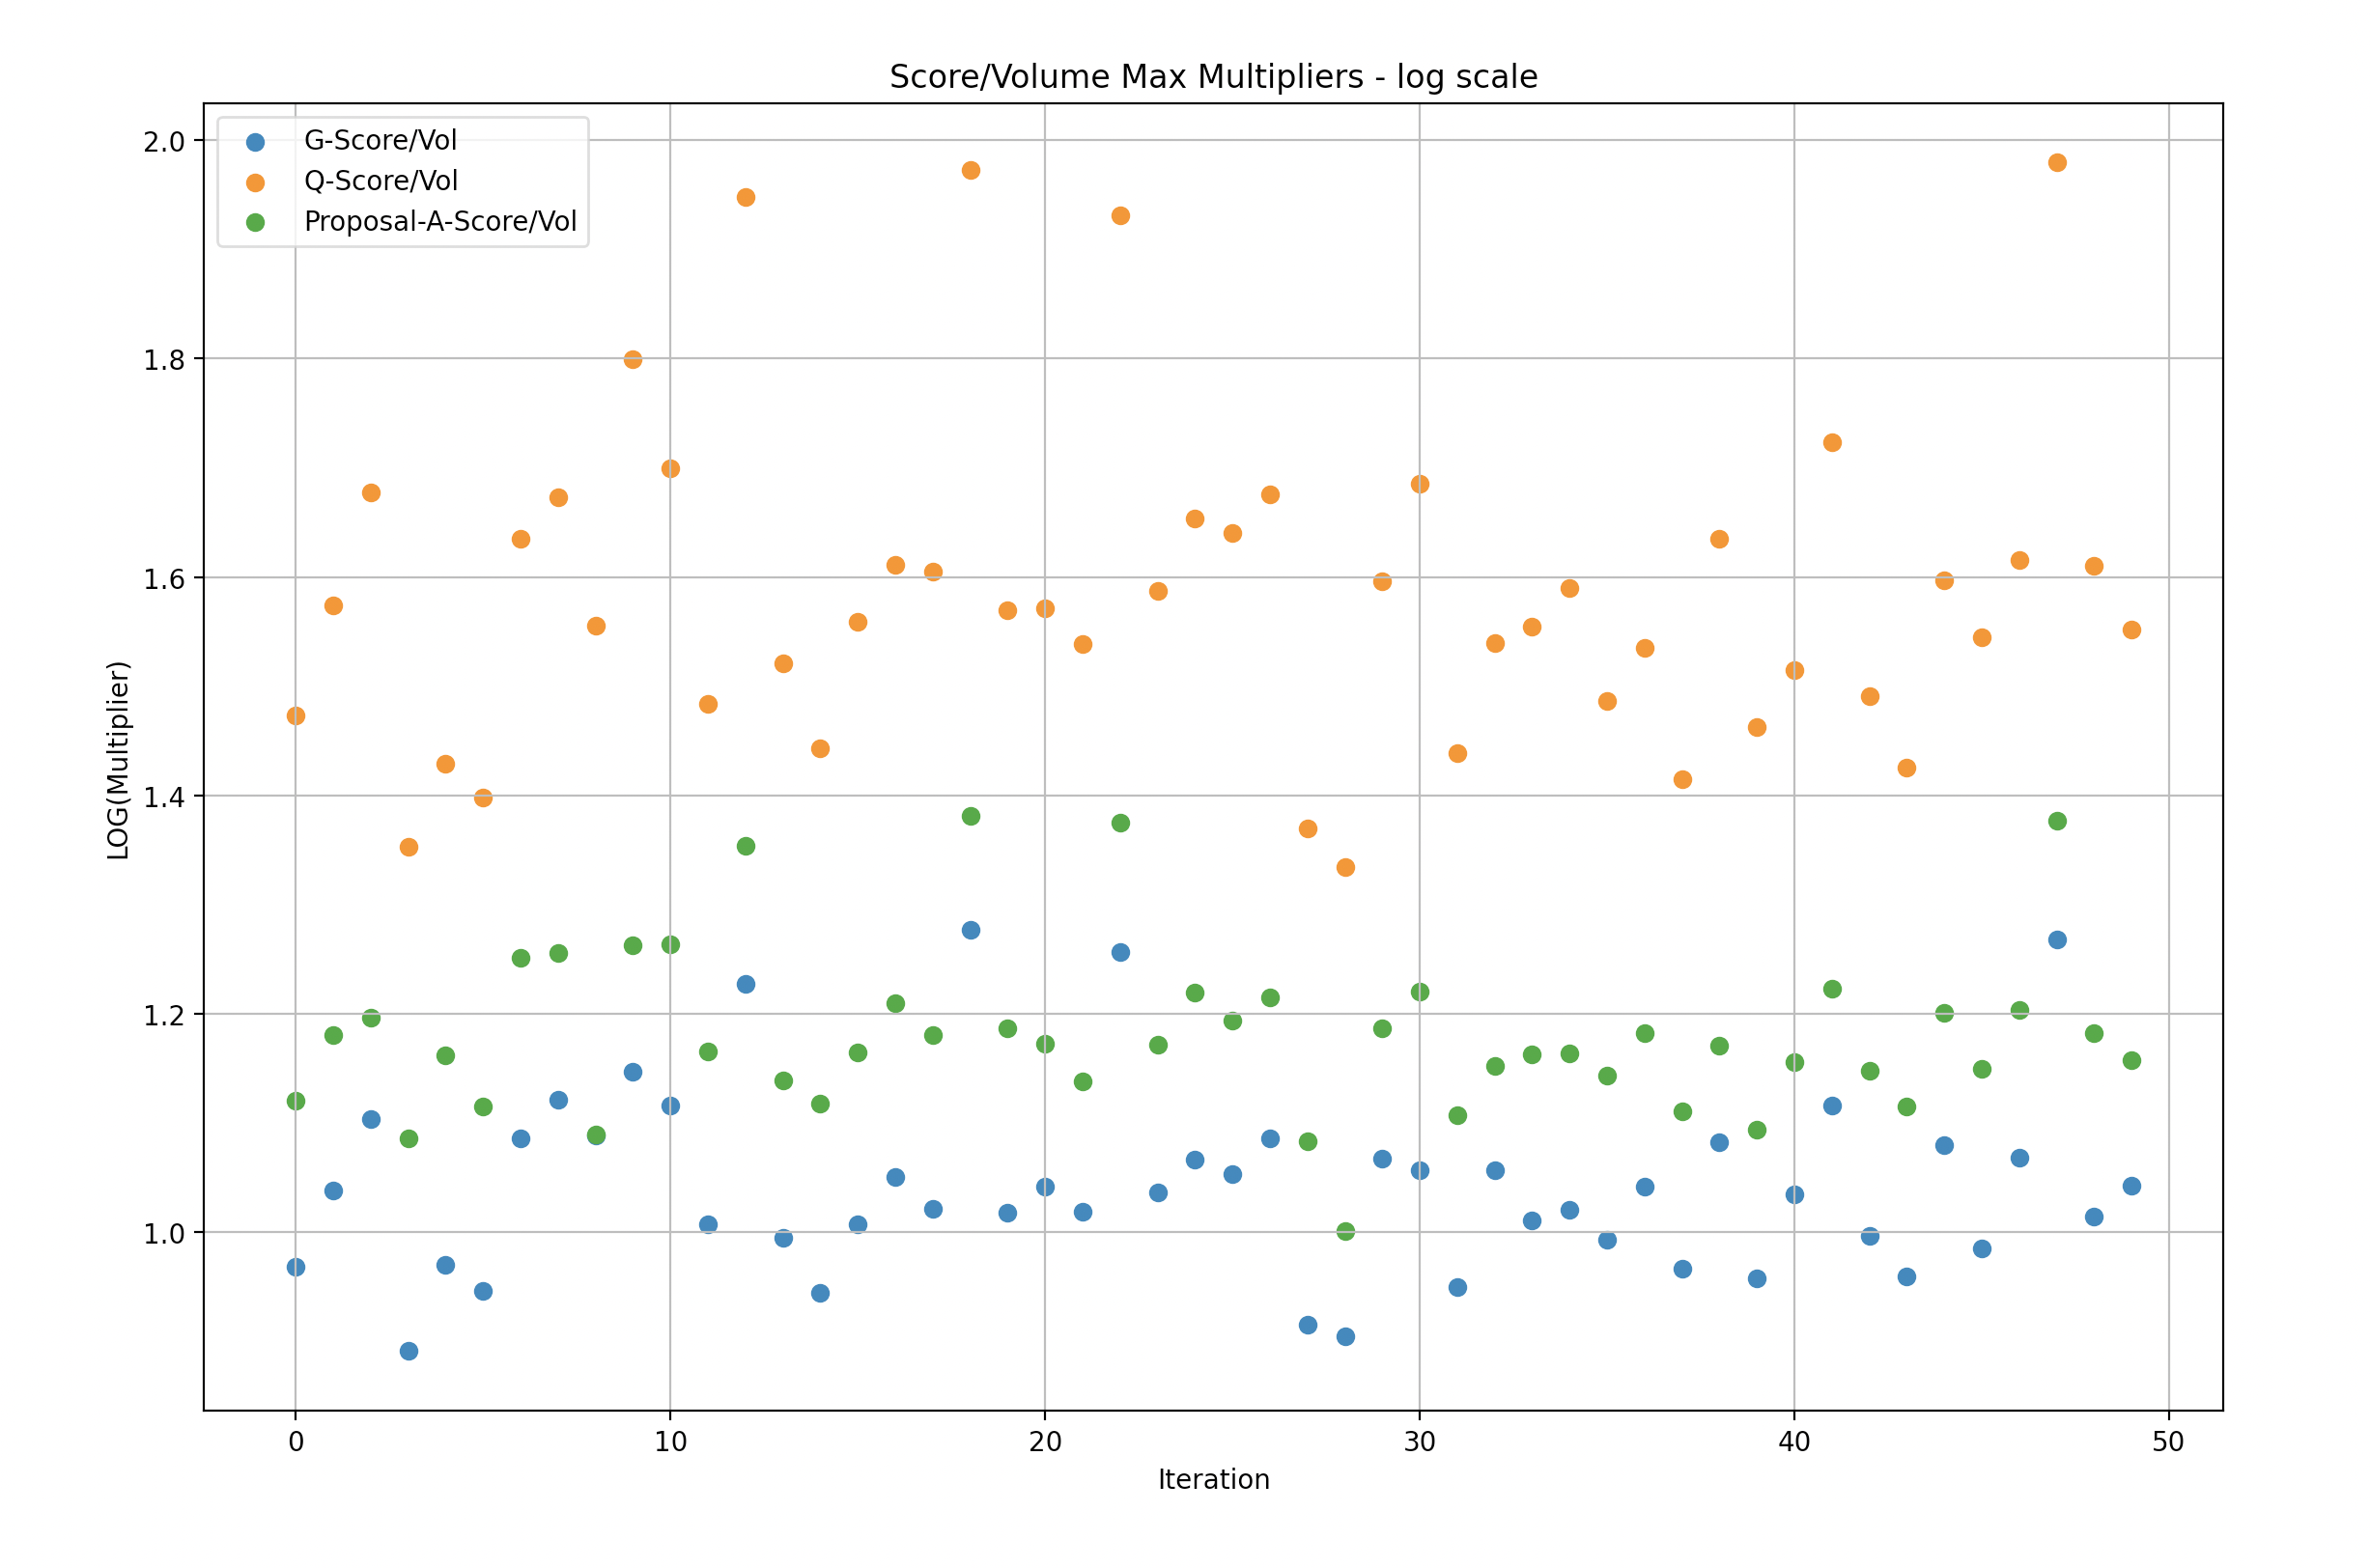
We narrowed the simulation samples to batches of 50 in order to expose the data in a way that is more digestible.
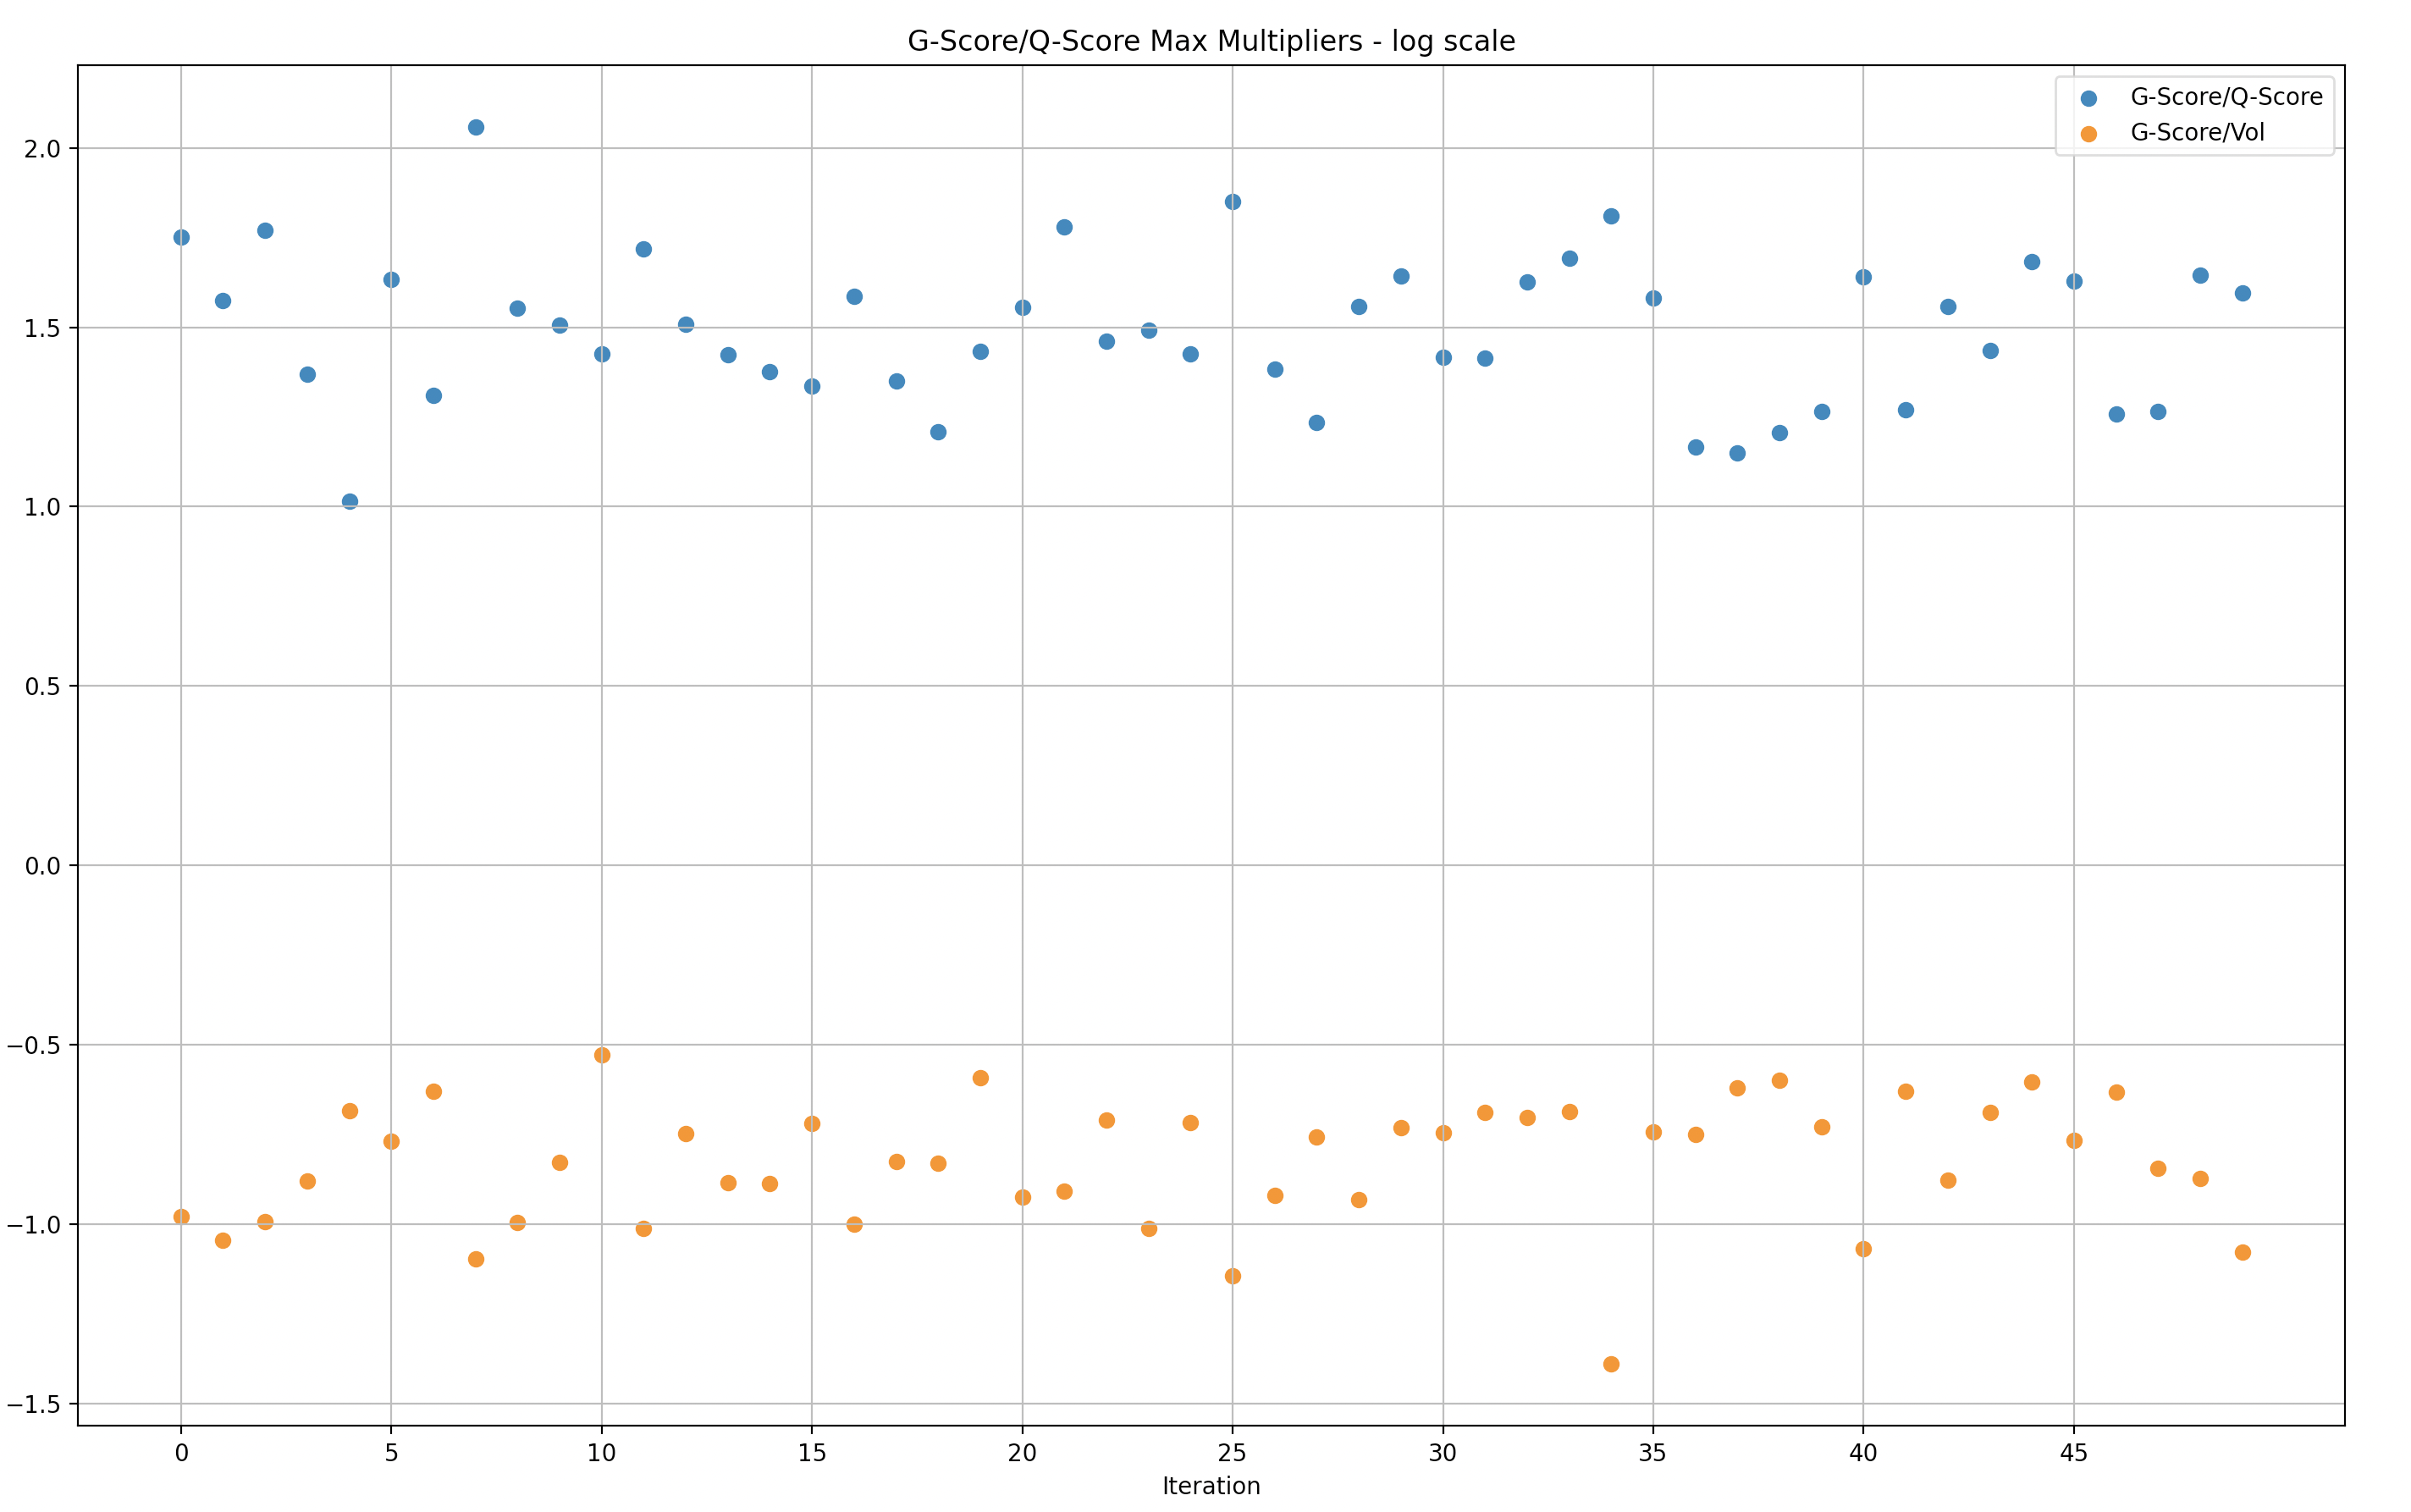
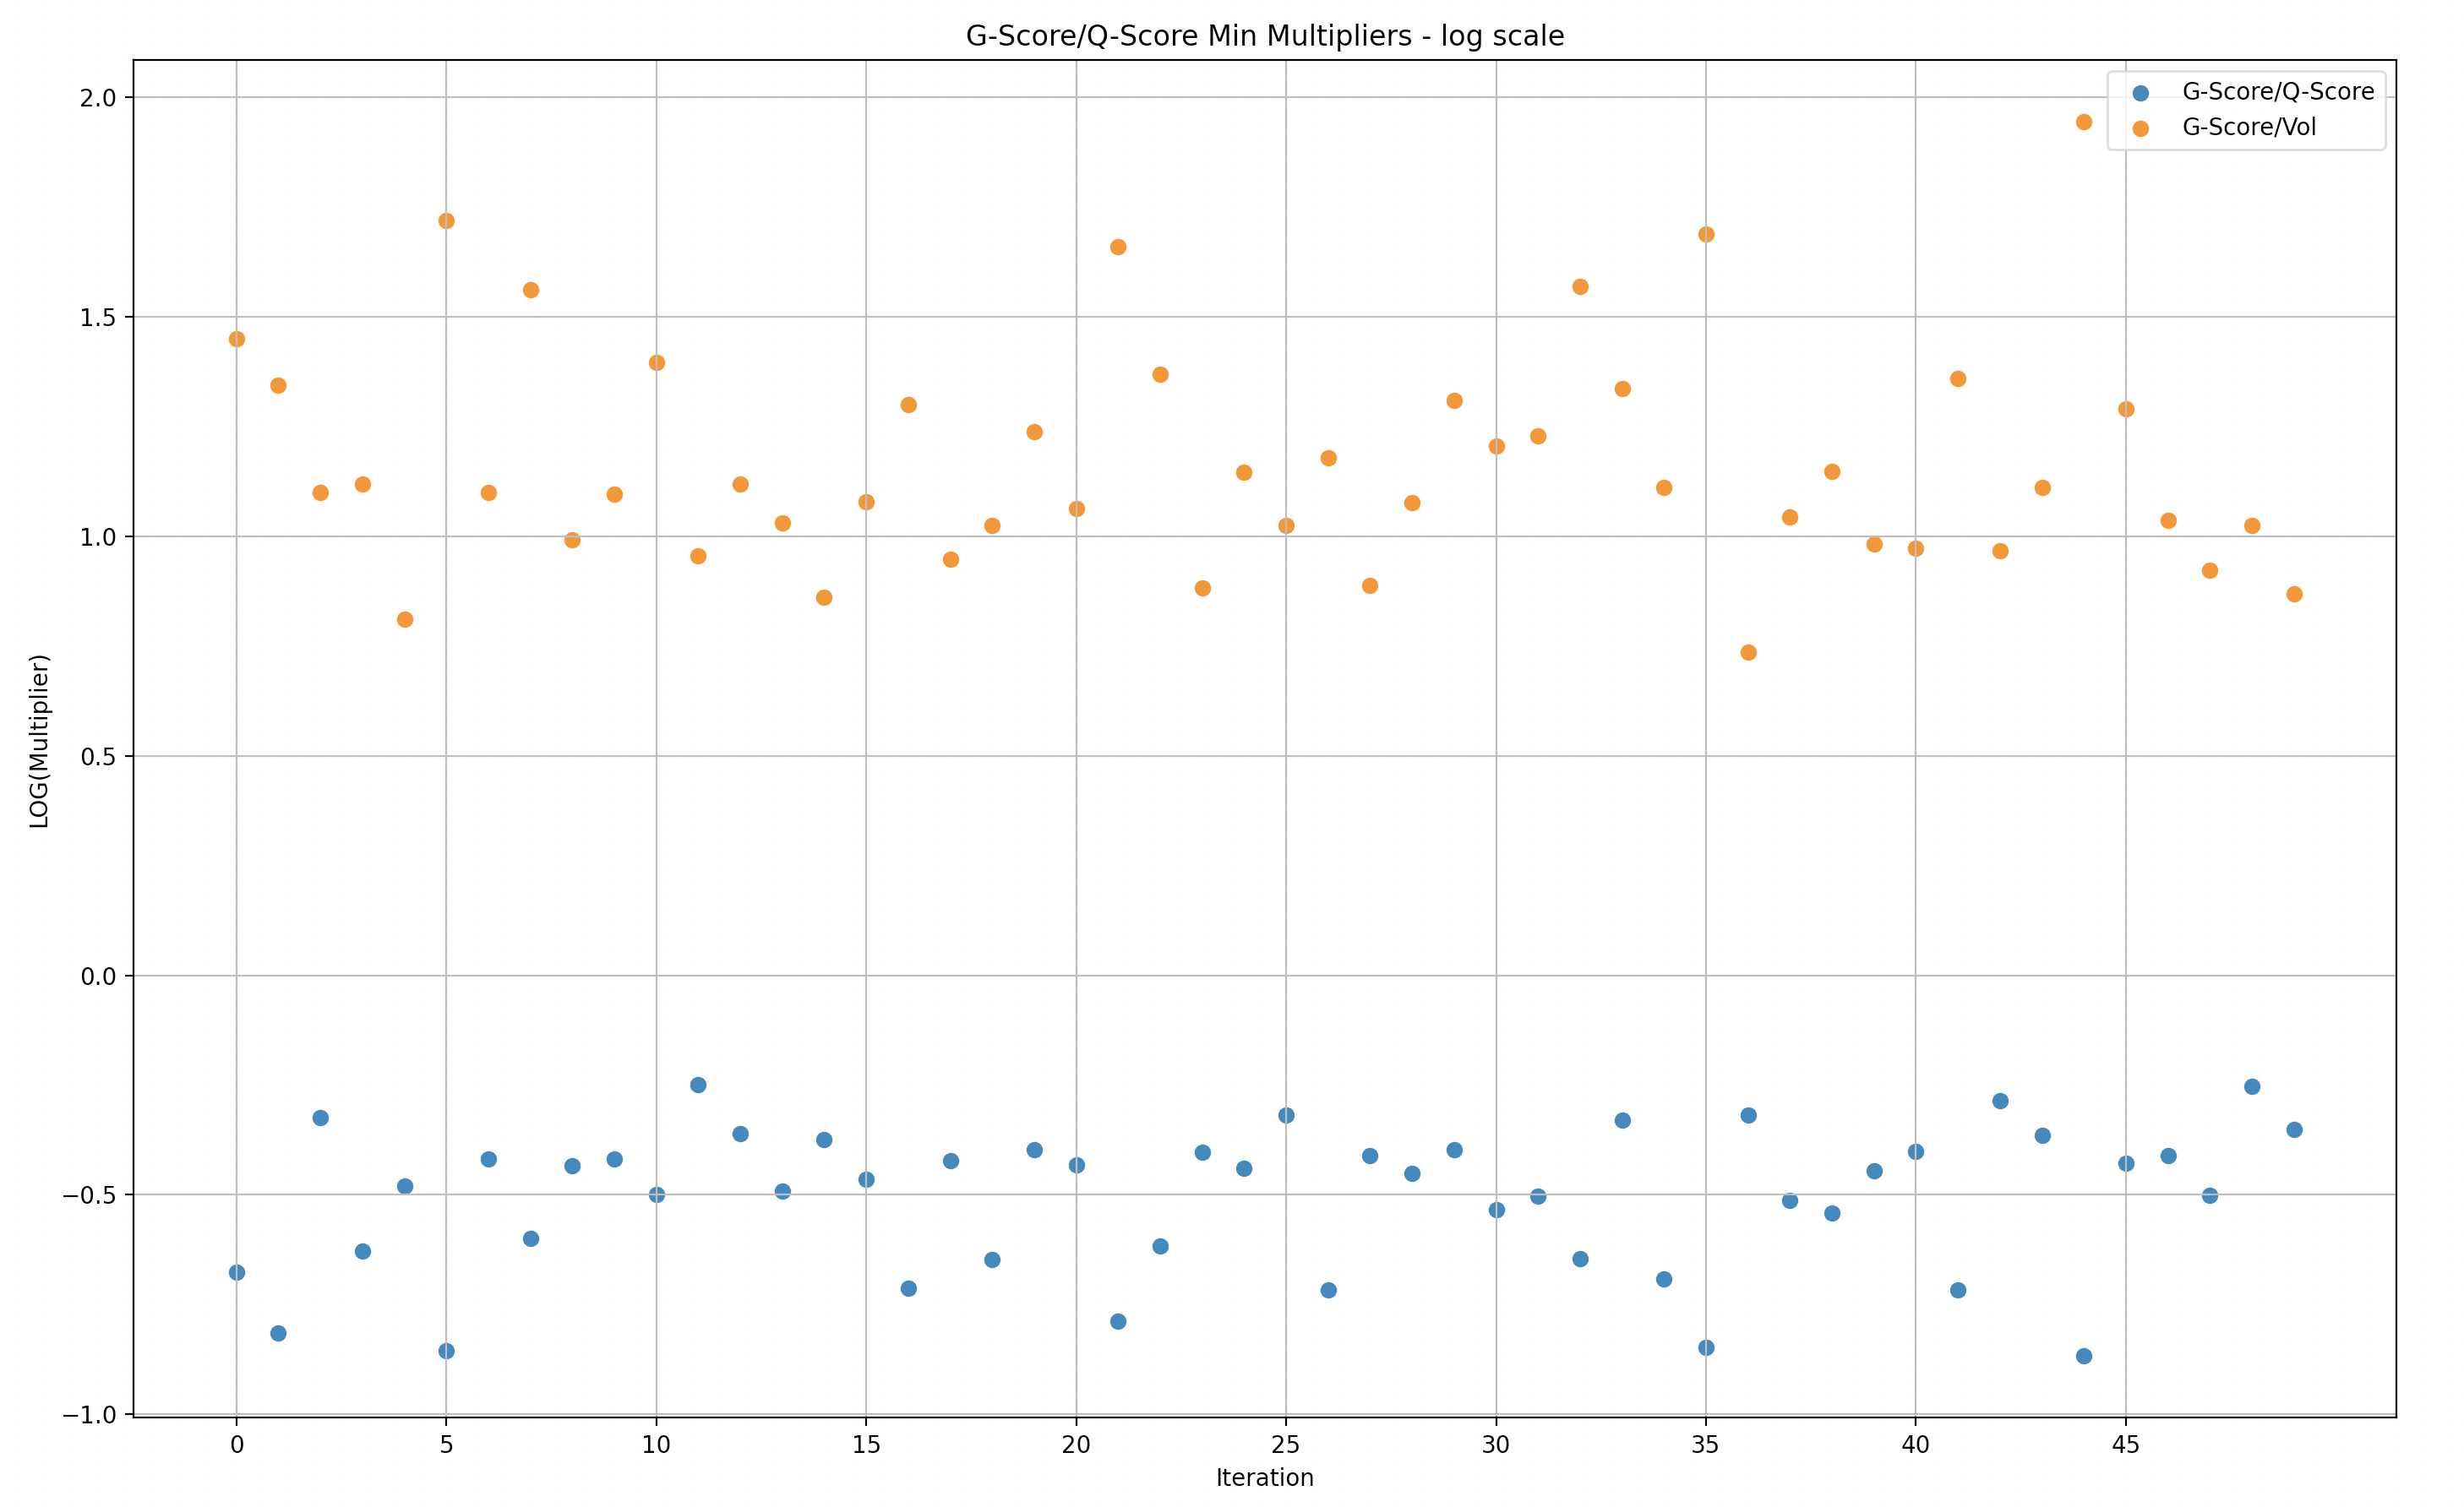
The following graphs show the maximum/minimum rewards multiplier versus volume. A multiplier of 1 means that the rewards are in 1:1 proportion to the volume of a certain LP, a multiplier of 2 means that the LP got rewards that are 2 times bigger than their share in the volume.
Note that the following presentations are in log scale so it will be easier to understand the gaps.

Y-Axis: Max G/Q score over volume in Log scale(multiplier of rewards versus Volume)
X-Axis: simulations (50)

Y-Axis: Min G/Q score over volume in Log scale(multiplier of rewards versus Volume)
X-Axis: simulations (50)
Y-Axis: Max G/Q/W score over volume in Log scale(multiplier of rewards versus Volume)
X-Axis: simulations (50)
Y-Axis: Min G/Q/W score over volume in Log scale(multiplier of rewards versus Volume)
X-Axis: simulations (50)
G-Score versus Q-Score
We narrowed the simulation samples to batches of 50 in order to expose the data in a way that is more digestible.
Similar to the data above for volume, these represent the data in relation to Q-score instead of volume. Also in log scale.
Y-Axis: Max G-score over Q-score in Log scale(multiplier of rewards versus Q-score)
X-Axis: simulations (50)
Y-Axis: Min G-score over Q-score in Log scale(multiplier of rewards versus Q-score)
X-Axis: simulations (50)
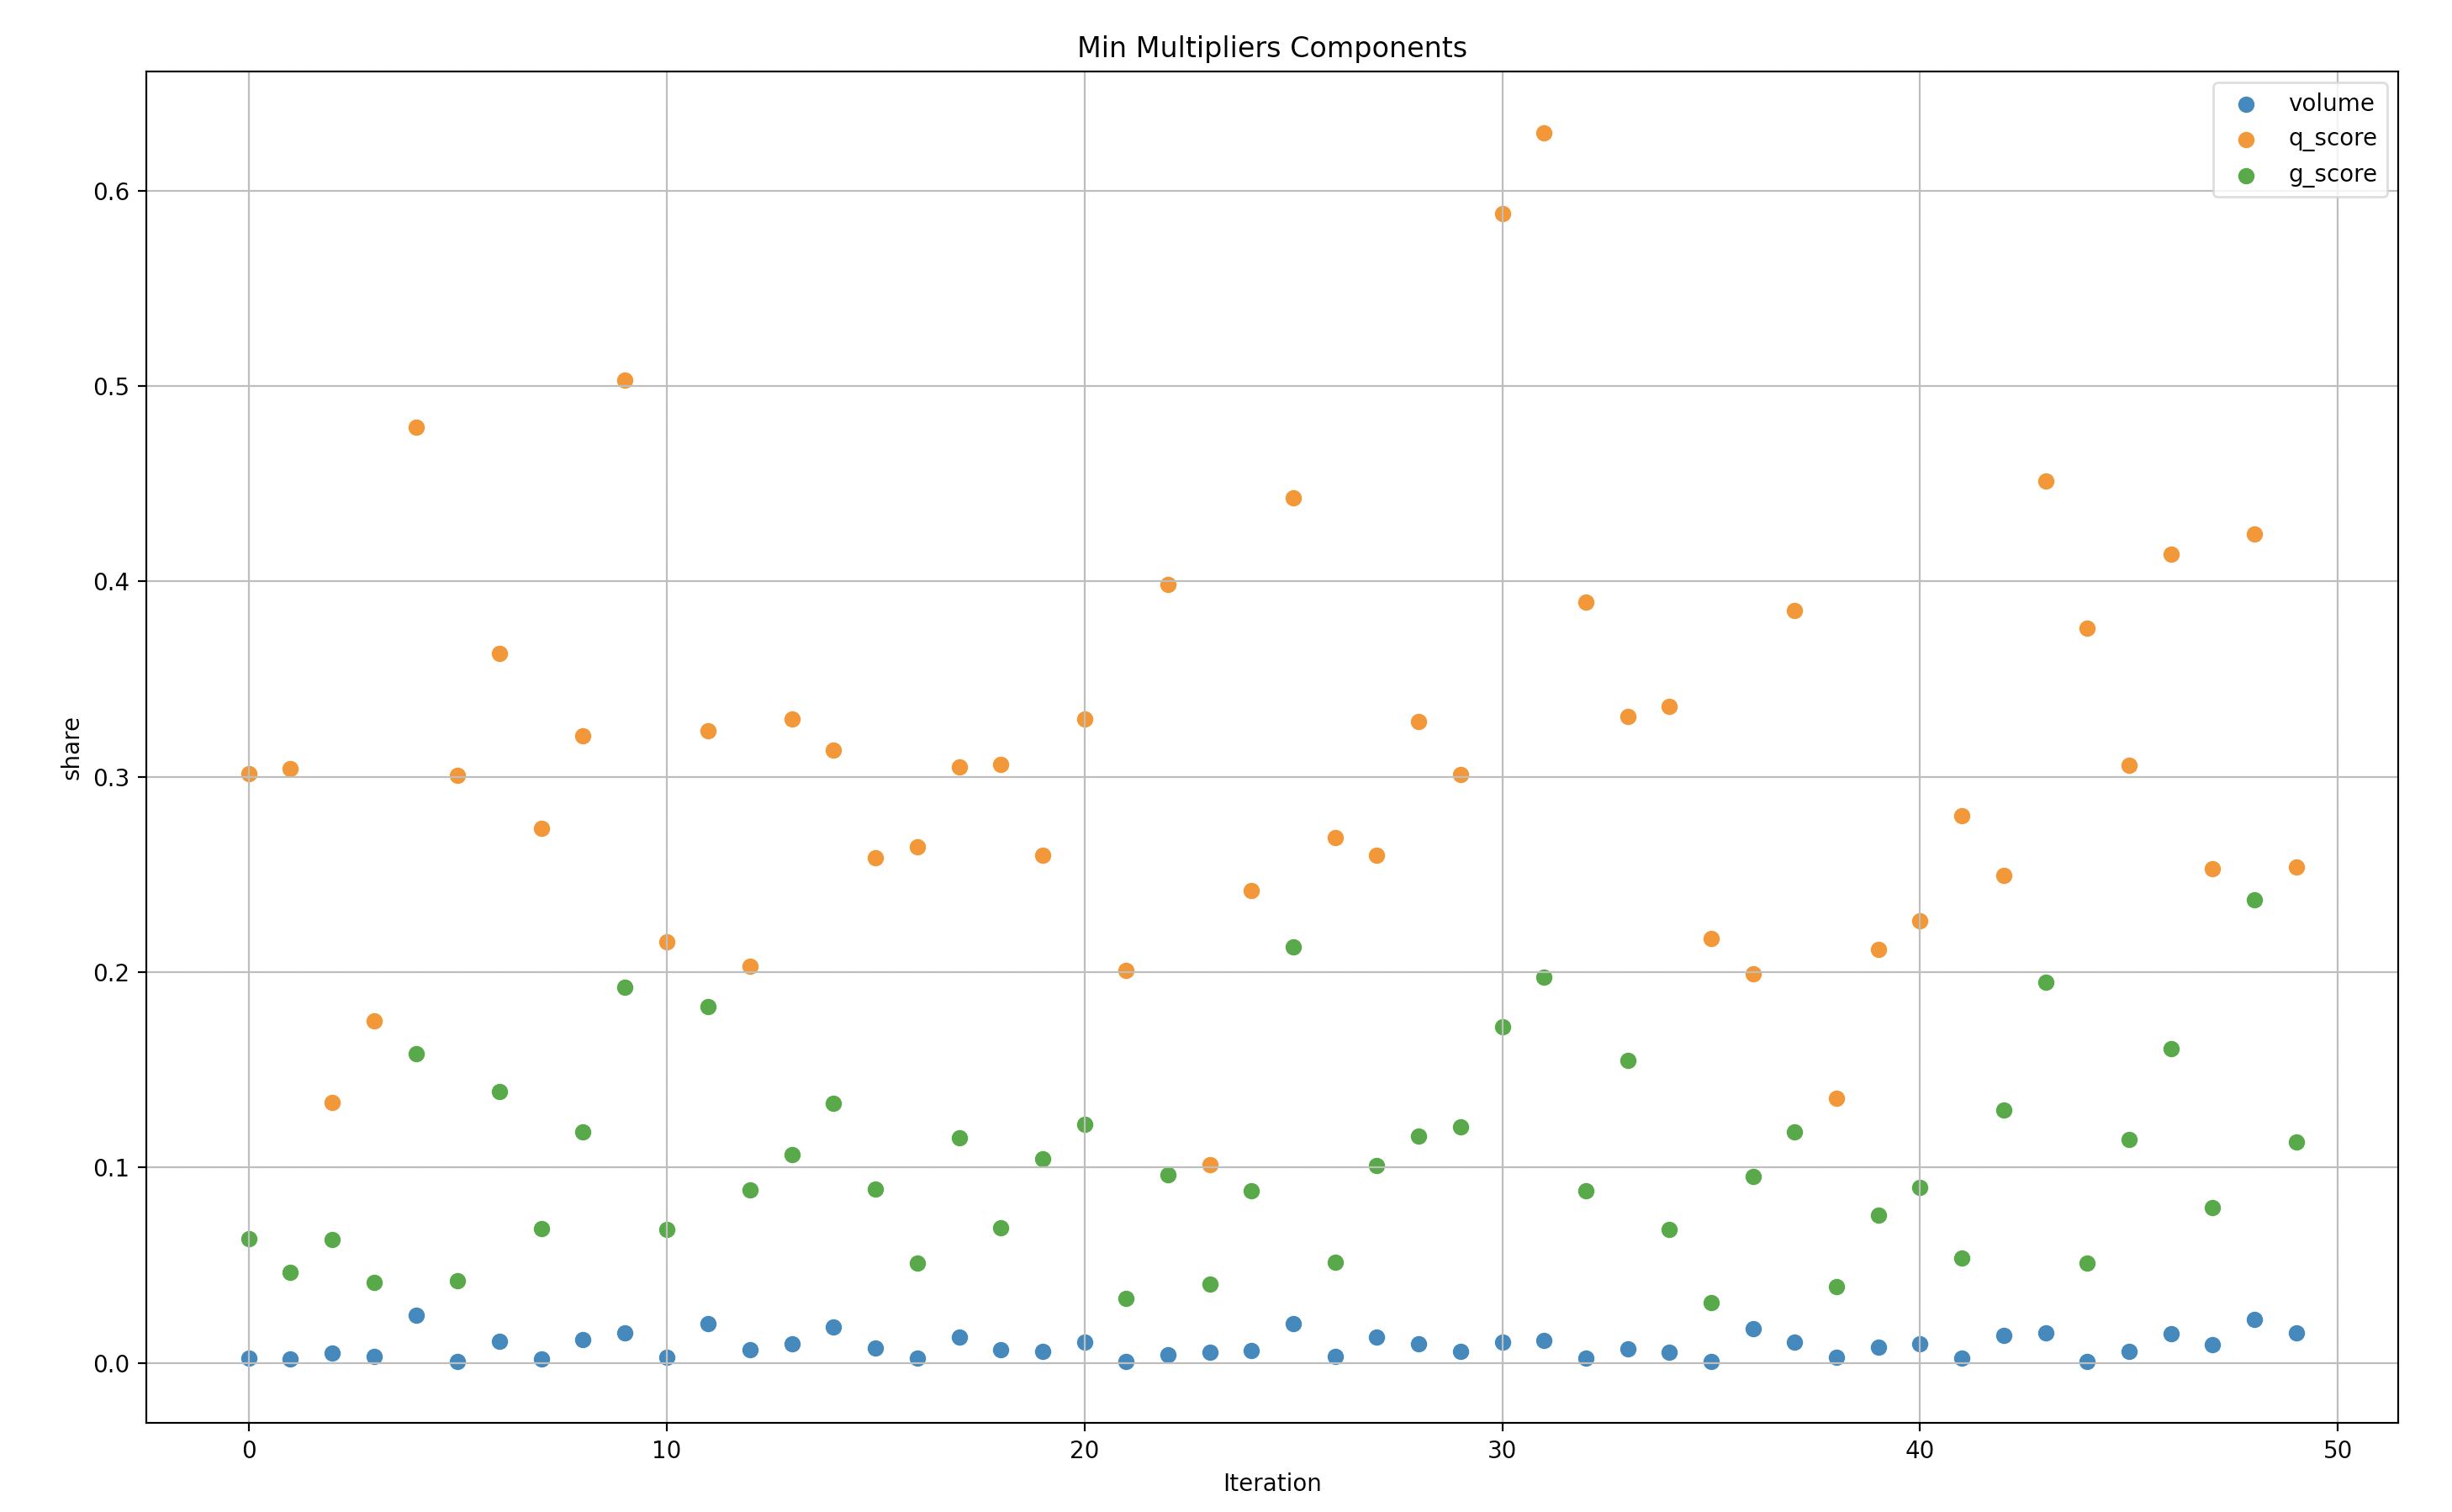
To give better context to the data above, we can see the specific top scorers that generated the ratios order in max and then minimum.

Simulations Result Summary
Based on our analysis of the simulation results it is clear that Weighted-Score/G-score is an improvement to the Q-score formula and more difficult for individual makers to manipulate. Most of the time Weighted-Score vs G-score show similar performance, however, Weighted-Score seems to perform better at mitigating disproportional single user rewards for the same simulation data sets, even when having either a disproportional Q-min score or volume share.
It is notable that there’s still work to be done to improve the efficiency of the Weighted-Score/G-score, minimizing the gaps between the Q-score and volume multipliers to the rewards. There are also risks that require further research and remediations in future iterations. These simulations, while powerful, don’t fully address (yet) these potential issues.
We have tried to highlight the “low-hanging” risks in this analysis, but in an ever-changing market, continuous review and analysis will be required to ensure that the formula and distribution strategy survive the test of time.
Next Steps
The above represents the tip of the iceberg in what research the Chaos Labs team intends to complete under this proposal. These simulations have been run to catch what is most obvious in terms of ways the equations could be gamed but have not begun to scratch the surface of potential risks.
We believe that with more time, Chaos Labs would be able to provide a more thorough analysis of the shortfalls of current proposals in addition to a newly proposed solution with a minimal surface area of attack.
Once a new equation is approved by the community, we will use these same simulations in addition to new market data to continue to stress test the LP rewards incentivization scheme to be most efficient at its stated goals: tightening spreads and competition on volumes.
Specific work we intend to do:
- Optimize to optimal weights for the future formula to achieve the fairest distribution according to the desired metrics.
- Review additional vulnerabilities/attack vectors in Q-score & G-score or Weighted-Score.
- Research and iterate to formulate more resilient scoring mechanisms for fairer and tamper-proof formulas
- Further explore situations of incentive misalignment (underpaying “good” makers, overpaying manipulators, etc.)
- Ongoing monitoring and adjustments to stay one step ahead
About the dYdX Grant Program
If you want to learn more about the dYdX Grants Program, check out their blog.